Guatemalan vs Immigrants from Croatia Householder Income Over 65 years
COMPARE
Guatemalan
Immigrants from Croatia
Householder Income Over 65 years
Householder Income Over 65 years Comparison
Guatemalans
Immigrants from Croatia
$54,526
HOUSEHOLDER INCOME OVER 65 YEARS
0.1/ 100
METRIC RATING
267th/ 347
METRIC RANK
$63,168
HOUSEHOLDER INCOME OVER 65 YEARS
90.9/ 100
METRIC RATING
117th/ 347
METRIC RANK
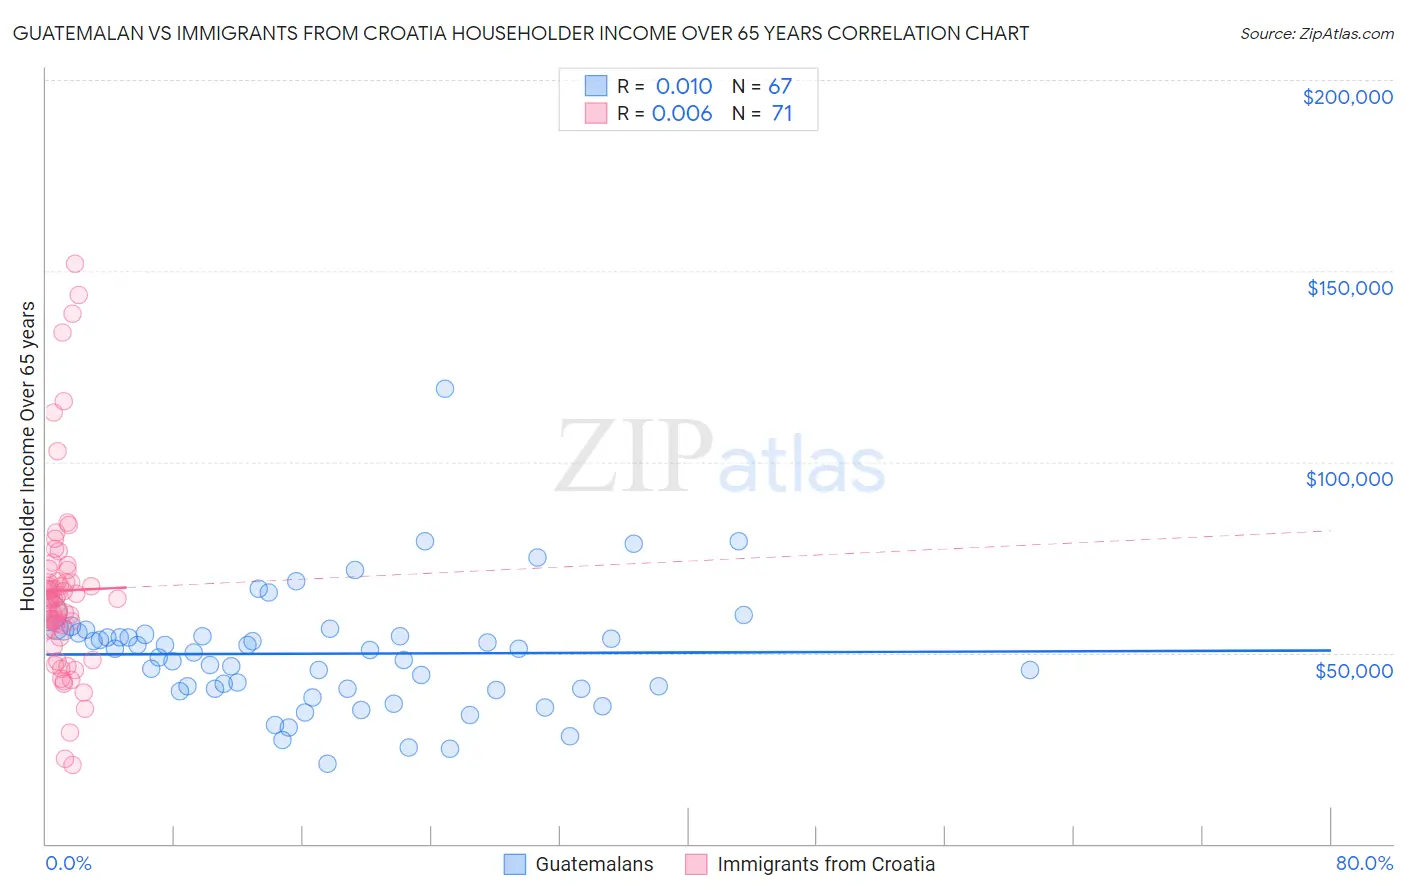
Guatemalan vs Immigrants from Croatia Householder Income Over 65 years Correlation Chart
The statistical analysis conducted on geographies consisting of 407,984,309 people shows no correlation between the proportion of Guatemalans and household income with householder over the age of 65 in the United States with a correlation coefficient (R) of 0.010 and weighted average of $54,526. Similarly, the statistical analysis conducted on geographies consisting of 132,518,281 people shows no correlation between the proportion of Immigrants from Croatia and household income with householder over the age of 65 in the United States with a correlation coefficient (R) of 0.006 and weighted average of $63,168, a difference of 15.9%.
Householder Income Over 65 years Correlation Summary
| Measurement | Guatemalan | Immigrants from Croatia |
| Minimum | $20,921 | $20,764 |
| Maximum | $119,087 | $151,983 |
| Range | $98,166 | $131,219 |
| Mean | $49,790 | $66,306 |
| Median | $50,748 | $64,003 |
| Interquartile 25% (IQ1) | $40,636 | $56,104 |
| Interquartile 75% (IQ3) | $55,201 | $68,616 |
| Interquartile Range (IQR) | $14,565 | $12,512 |
| Standard Deviation (Sample) | $15,581 | $24,936 |
| Standard Deviation (Population) | $15,464 | $24,760 |
Similar Demographics by Householder Income Over 65 years
Demographics Similar to Guatemalans by Householder Income Over 65 years
In terms of householder income over 65 years, the demographic groups most similar to Guatemalans are Immigrants from Zaire ($54,512, a difference of 0.030%), Jamaican ($54,560, a difference of 0.060%), Belizean ($54,580, a difference of 0.10%), Nicaraguan ($54,474, a difference of 0.10%), and Immigrants from Senegal ($54,447, a difference of 0.15%).
| Demographics | Rating | Rank | Householder Income Over 65 years |
| Immigrants | West Indies | 0.2 /100 | #260 | Tragic $54,927 |
| Comanche | 0.2 /100 | #261 | Tragic $54,922 |
| Bangladeshis | 0.1 /100 | #262 | Tragic $54,719 |
| French American Indians | 0.1 /100 | #263 | Tragic $54,699 |
| Apache | 0.1 /100 | #264 | Tragic $54,668 |
| Belizeans | 0.1 /100 | #265 | Tragic $54,580 |
| Jamaicans | 0.1 /100 | #266 | Tragic $54,560 |
| Guatemalans | 0.1 /100 | #267 | Tragic $54,526 |
| Immigrants | Zaire | 0.1 /100 | #268 | Tragic $54,512 |
| Nicaraguans | 0.1 /100 | #269 | Tragic $54,474 |
| Immigrants | Senegal | 0.1 /100 | #270 | Tragic $54,447 |
| Liberians | 0.1 /100 | #271 | Tragic $54,356 |
| Potawatomi | 0.1 /100 | #272 | Tragic $54,212 |
| Indonesians | 0.1 /100 | #273 | Tragic $54,176 |
| Barbadians | 0.1 /100 | #274 | Tragic $54,163 |
Demographics Similar to Immigrants from Croatia by Householder Income Over 65 years
In terms of householder income over 65 years, the demographic groups most similar to Immigrants from Croatia are Guamanian/Chamorro ($63,187, a difference of 0.030%), Danish ($63,117, a difference of 0.080%), Croatian ($63,225, a difference of 0.090%), Immigrants from Jordan ($63,041, a difference of 0.20%), and Ukrainian ($63,032, a difference of 0.22%).
| Demographics | Rating | Rank | Householder Income Over 65 years |
| Immigrants | Zimbabwe | 94.3 /100 | #110 | Exceptional $63,643 |
| Immigrants | Spain | 93.7 /100 | #111 | Exceptional $63,540 |
| Syrians | 93.4 /100 | #112 | Exceptional $63,494 |
| Immigrants | Serbia | 92.7 /100 | #113 | Exceptional $63,387 |
| Immigrants | Saudi Arabia | 92.4 /100 | #114 | Exceptional $63,355 |
| Croatians | 91.4 /100 | #115 | Exceptional $63,225 |
| Guamanians/Chamorros | 91.1 /100 | #116 | Exceptional $63,187 |
| Immigrants | Croatia | 90.9 /100 | #117 | Exceptional $63,168 |
| Danes | 90.5 /100 | #118 | Exceptional $63,117 |
| Immigrants | Jordan | 89.8 /100 | #119 | Excellent $63,041 |
| Ukrainians | 89.7 /100 | #120 | Excellent $63,032 |
| Immigrants | Vietnam | 89.5 /100 | #121 | Excellent $63,014 |
| Immigrants | Moldova | 88.7 /100 | #122 | Excellent $62,939 |
| Tlingit-Haida | 88.6 /100 | #123 | Excellent $62,922 |
| Taiwanese | 88.3 /100 | #124 | Excellent $62,894 |