Guamanian/Chamorro vs Immigrants from South America Associate's Degree
COMPARE
Guamanian/Chamorro
Immigrants from South America
Associate's Degree
Associate's Degree Comparison
Guamanians/Chamorros
Immigrants from South America
43.8%
ASSOCIATE'S DEGREE
4.8/ 100
METRIC RATING
225th/ 347
METRIC RANK
46.7%
ASSOCIATE'S DEGREE
59.9/ 100
METRIC RATING
165th/ 347
METRIC RANK
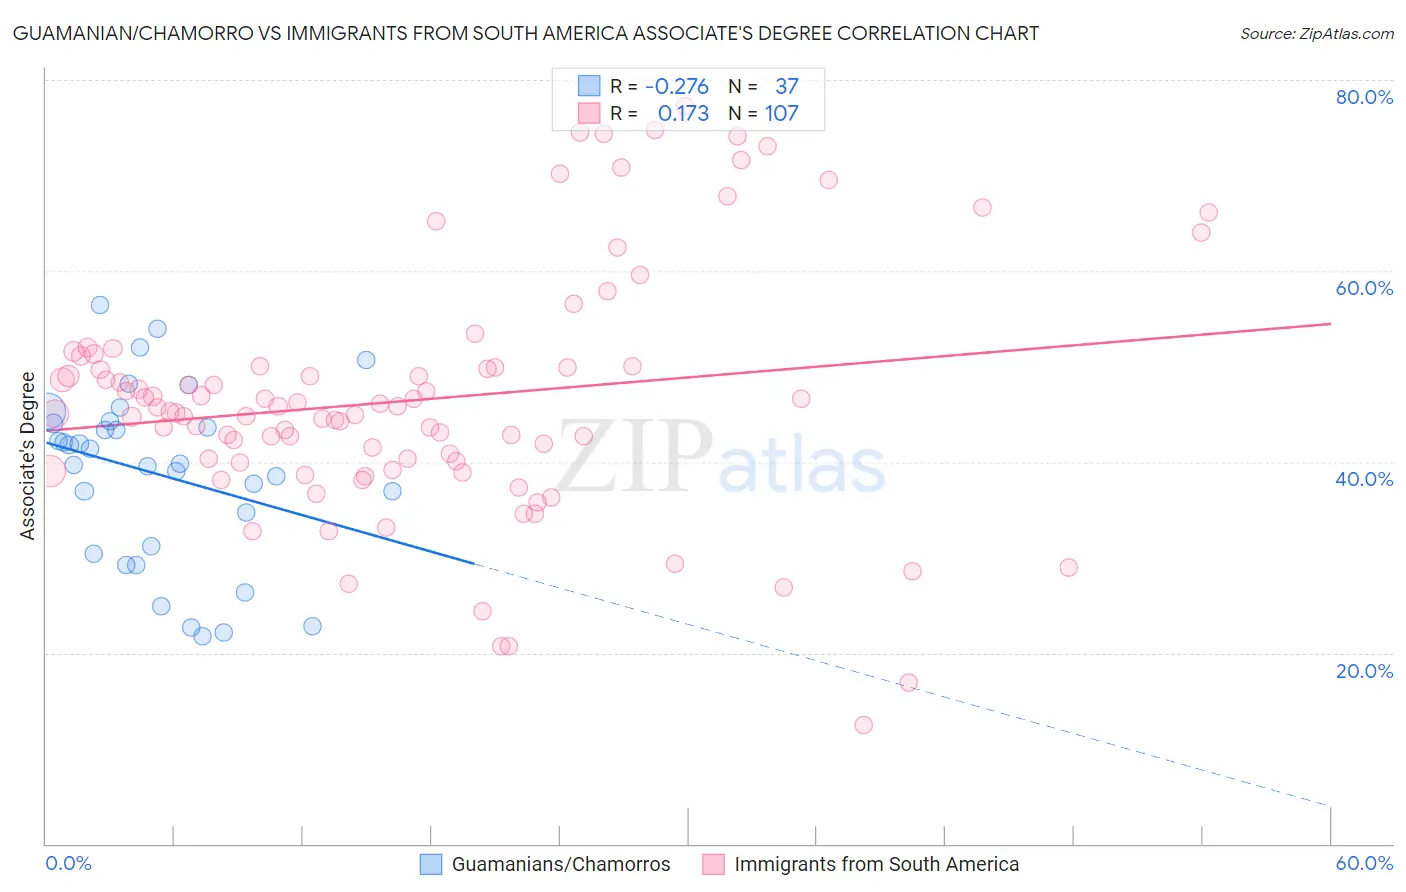
Guamanian/Chamorro vs Immigrants from South America Associate's Degree Correlation Chart
The statistical analysis conducted on geographies consisting of 221,965,027 people shows a weak negative correlation between the proportion of Guamanians/Chamorros and percentage of population with at least associate's degree education in the United States with a correlation coefficient (R) of -0.276 and weighted average of 43.8%. Similarly, the statistical analysis conducted on geographies consisting of 486,384,317 people shows a poor positive correlation between the proportion of Immigrants from South America and percentage of population with at least associate's degree education in the United States with a correlation coefficient (R) of 0.173 and weighted average of 46.7%, a difference of 6.7%.
Associate's Degree Correlation Summary
| Measurement | Guamanian/Chamorro | Immigrants from South America |
| Minimum | 21.7% | 12.4% |
| Maximum | 56.4% | 77.3% |
| Range | 34.7% | 64.9% |
| Mean | 38.7% | 46.5% |
| Median | 39.8% | 45.2% |
| Interquartile 25% (IQ1) | 30.8% | 40.0% |
| Interquartile 75% (IQ3) | 44.1% | 50.0% |
| Interquartile Range (IQR) | 13.4% | 10.0% |
| Standard Deviation (Sample) | 9.2% | 12.9% |
| Standard Deviation (Population) | 9.1% | 12.8% |
Similar Demographics by Associate's Degree
Demographics Similar to Guamanians/Chamorros by Associate's Degree
In terms of associate's degree, the demographic groups most similar to Guamanians/Chamorros are West Indian (43.8%, a difference of 0.15%), Immigrants from Burma/Myanmar (43.7%, a difference of 0.22%), Subsaharan African (43.9%, a difference of 0.29%), Barbadian (43.9%, a difference of 0.39%), and Trinidadian and Tobagonian (43.6%, a difference of 0.39%).
| Demographics | Rating | Rank | Associate's Degree |
| Spanish | 9.4 /100 | #218 | Tragic 44.4% |
| Whites/Caucasians | 7.5 /100 | #219 | Tragic 44.2% |
| Portuguese | 7.2 /100 | #220 | Tragic 44.1% |
| Immigrants | Western Africa | 6.6 /100 | #221 | Tragic 44.1% |
| Barbadians | 5.8 /100 | #222 | Tragic 43.9% |
| Sub-Saharan Africans | 5.5 /100 | #223 | Tragic 43.9% |
| West Indians | 5.2 /100 | #224 | Tragic 43.8% |
| Guamanians/Chamorros | 4.8 /100 | #225 | Tragic 43.8% |
| Immigrants | Burma/Myanmar | 4.3 /100 | #226 | Tragic 43.7% |
| Trinidadians and Tobagonians | 4.0 /100 | #227 | Tragic 43.6% |
| Hmong | 3.2 /100 | #228 | Tragic 43.4% |
| Immigrants | Trinidad and Tobago | 3.0 /100 | #229 | Tragic 43.3% |
| Immigrants | Barbados | 2.9 /100 | #230 | Tragic 43.3% |
| Liberians | 2.9 /100 | #231 | Tragic 43.3% |
| Native Hawaiians | 2.3 /100 | #232 | Tragic 43.1% |
Demographics Similar to Immigrants from South America by Associate's Degree
In terms of associate's degree, the demographic groups most similar to Immigrants from South America are Hungarian (46.7%, a difference of 0.040%), Immigrants from Sierra Leone (46.7%, a difference of 0.050%), Colombian (46.8%, a difference of 0.20%), Somali (46.8%, a difference of 0.21%), and Immigrants from Africa (46.8%, a difference of 0.26%).
| Demographics | Rating | Rank | Associate's Degree |
| Immigrants | Germany | 69.7 /100 | #158 | Good 47.1% |
| Immigrants | Poland | 69.2 /100 | #159 | Good 47.1% |
| Scottish | 65.4 /100 | #160 | Good 46.9% |
| Scandinavians | 65.2 /100 | #161 | Good 46.9% |
| Immigrants | Africa | 63.2 /100 | #162 | Good 46.8% |
| Somalis | 62.5 /100 | #163 | Good 46.8% |
| Colombians | 62.4 /100 | #164 | Good 46.8% |
| Immigrants | South America | 59.9 /100 | #165 | Average 46.7% |
| Hungarians | 59.3 /100 | #166 | Average 46.7% |
| Immigrants | Sierra Leone | 59.2 /100 | #167 | Average 46.7% |
| Immigrants | Somalia | 55.5 /100 | #168 | Average 46.5% |
| Uruguayans | 55.4 /100 | #169 | Average 46.5% |
| Irish | 53.6 /100 | #170 | Average 46.5% |
| Basques | 52.8 /100 | #171 | Average 46.5% |
| Peruvians | 50.5 /100 | #172 | Average 46.4% |