Guamanian/Chamorro vs European In Labor Force | Age 30-34
COMPARE
Guamanian/Chamorro
European
In Labor Force | Age 30-34
In Labor Force | Age 30-34 Comparison
Guamanians/Chamorros
Europeans
83.5%
IN LABOR FORCE | AGE 30-34
0.0/ 100
METRIC RATING
273rd/ 347
METRIC RANK
84.3%
IN LABOR FORCE | AGE 30-34
7.2/ 100
METRIC RATING
215th/ 347
METRIC RANK
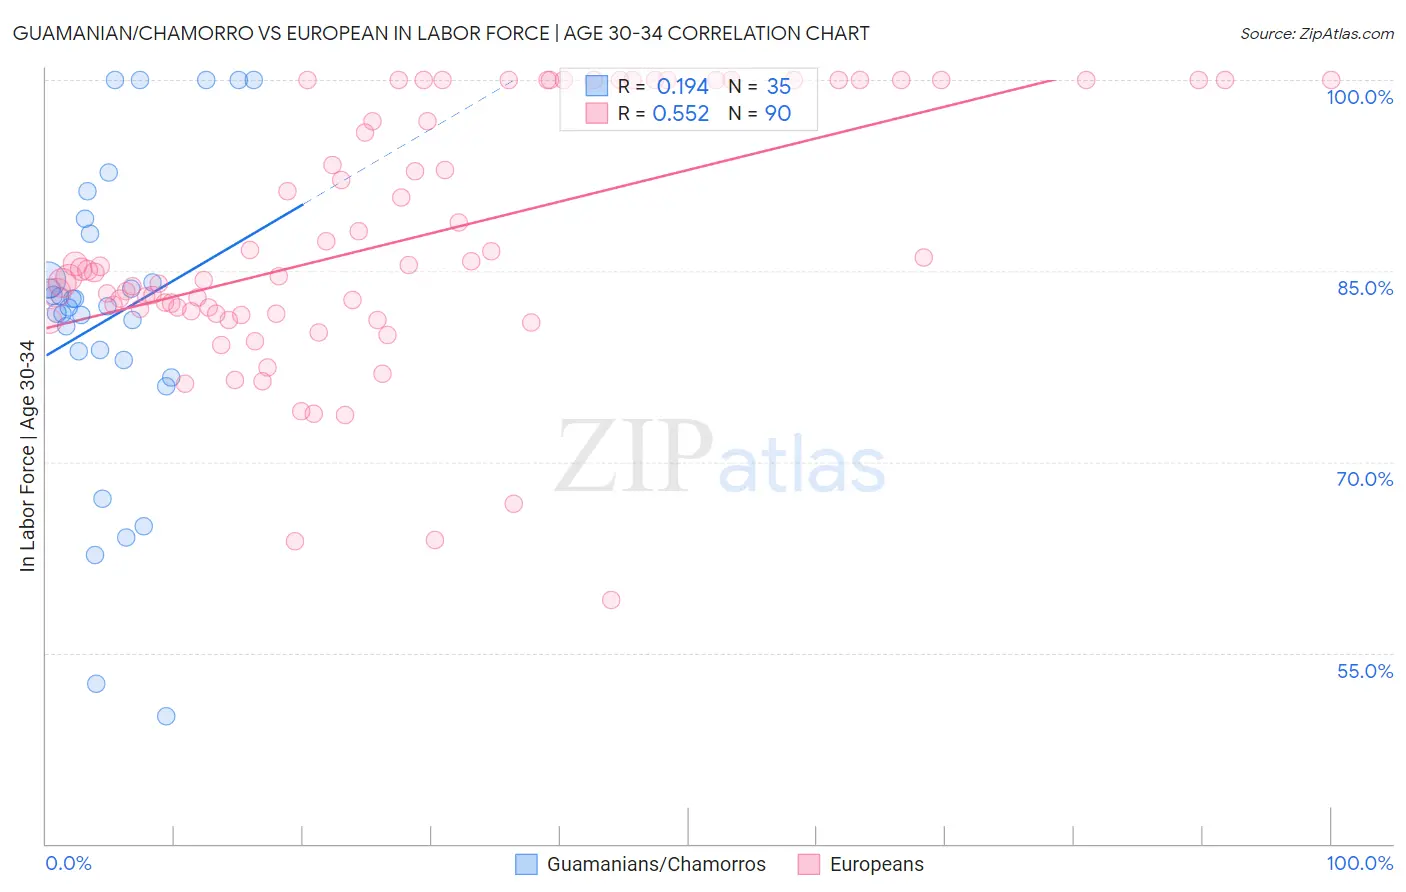
Guamanian/Chamorro vs European In Labor Force | Age 30-34 Correlation Chart
The statistical analysis conducted on geographies consisting of 221,913,161 people shows a poor positive correlation between the proportion of Guamanians/Chamorros and labor force participation rate among population between the ages 30 and 34 in the United States with a correlation coefficient (R) of 0.194 and weighted average of 83.5%. Similarly, the statistical analysis conducted on geographies consisting of 560,760,193 people shows a substantial positive correlation between the proportion of Europeans and labor force participation rate among population between the ages 30 and 34 in the United States with a correlation coefficient (R) of 0.552 and weighted average of 84.3%, a difference of 0.98%.
In Labor Force | Age 30-34 Correlation Summary
| Measurement | Guamanian/Chamorro | European |
| Minimum | 50.0% | 59.1% |
| Maximum | 100.0% | 100.0% |
| Range | 50.0% | 40.9% |
| Mean | 81.4% | 87.3% |
| Median | 82.3% | 85.0% |
| Interquartile 25% (IQ1) | 78.0% | 81.7% |
| Interquartile 75% (IQ3) | 87.9% | 100.0% |
| Interquartile Range (IQR) | 9.9% | 18.3% |
| Standard Deviation (Sample) | 12.3% | 9.8% |
| Standard Deviation (Population) | 12.1% | 9.8% |
Similar Demographics by In Labor Force | Age 30-34
Demographics Similar to Guamanians/Chamorros by In Labor Force | Age 30-34
In terms of in labor force | age 30-34, the demographic groups most similar to Guamanians/Chamorros are Belizean (83.5%, a difference of 0.010%), Immigrants from Grenada (83.5%, a difference of 0.020%), Tongan (83.5%, a difference of 0.020%), Delaware (83.5%, a difference of 0.040%), and Spanish (83.5%, a difference of 0.050%).
| Demographics | Rating | Rank | In Labor Force | Age 30-34 |
| Immigrants | Guatemala | 0.1 /100 | #266 | Tragic 83.7% |
| Spaniards | 0.1 /100 | #267 | Tragic 83.6% |
| Immigrants | Bangladesh | 0.1 /100 | #268 | Tragic 83.6% |
| Vietnamese | 0.1 /100 | #269 | Tragic 83.6% |
| Spanish Americans | 0.0 /100 | #270 | Tragic 83.5% |
| Spanish | 0.0 /100 | #271 | Tragic 83.5% |
| Immigrants | Nonimmigrants | 0.0 /100 | #272 | Tragic 83.5% |
| Guamanians/Chamorros | 0.0 /100 | #273 | Tragic 83.5% |
| Belizeans | 0.0 /100 | #274 | Tragic 83.5% |
| Immigrants | Grenada | 0.0 /100 | #275 | Tragic 83.5% |
| Tongans | 0.0 /100 | #276 | Tragic 83.5% |
| Delaware | 0.0 /100 | #277 | Tragic 83.5% |
| Fijians | 0.0 /100 | #278 | Tragic 83.4% |
| Immigrants | Fiji | 0.0 /100 | #279 | Tragic 83.4% |
| Africans | 0.0 /100 | #280 | Tragic 83.4% |
Demographics Similar to Europeans by In Labor Force | Age 30-34
In terms of in labor force | age 30-34, the demographic groups most similar to Europeans are Immigrants from Germany (84.3%, a difference of 0.0%), Immigrants from Ecuador (84.3%, a difference of 0.0%), Immigrants from Trinidad and Tobago (84.3%, a difference of 0.010%), Immigrants from Western Asia (84.3%, a difference of 0.020%), and Immigrants from Jamaica (84.3%, a difference of 0.020%).
| Demographics | Rating | Rank | In Labor Force | Age 30-34 |
| Arabs | 8.9 /100 | #208 | Tragic 84.3% |
| Jamaicans | 8.8 /100 | #209 | Tragic 84.3% |
| Indonesians | 8.8 /100 | #210 | Tragic 84.3% |
| Japanese | 8.8 /100 | #211 | Tragic 84.3% |
| Immigrants | Western Asia | 8.2 /100 | #212 | Tragic 84.3% |
| Immigrants | Jamaica | 7.9 /100 | #213 | Tragic 84.3% |
| Immigrants | Germany | 7.2 /100 | #214 | Tragic 84.3% |
| Europeans | 7.2 /100 | #215 | Tragic 84.3% |
| Immigrants | Ecuador | 7.1 /100 | #216 | Tragic 84.3% |
| Immigrants | Trinidad and Tobago | 7.0 /100 | #217 | Tragic 84.3% |
| Immigrants | Panama | 6.3 /100 | #218 | Tragic 84.3% |
| Swiss | 5.8 /100 | #219 | Tragic 84.3% |
| Danes | 5.3 /100 | #220 | Tragic 84.3% |
| Salvadorans | 3.8 /100 | #221 | Tragic 84.2% |
| Panamanians | 3.8 /100 | #222 | Tragic 84.2% |