Greek vs Subsaharan African Bachelor's Degree

COMPARE

Greek
Race
Ancestry
AfghanAfricanAlaska NativeAlaskan AthabascanAlbanianAleutAlsatianAmericanApacheArabArapahoArgentineanArmenianAssyrian/Chaldean/SyriacAustralianAustrianBahamianBangladeshiBarbadianBasqueBelgianBelizeanBermudanBhutaneseBlackfeetBolivianBrazilianBritishBritish West IndianBulgarianBurmeseCajunCambodianCanadianCape VerdeanCarpatho RusynCelticCentral AmericanCentral American IndianCherokeeCheyenneChickasawChileanChineseChippewaChoctawColombianColvilleComancheCosta RicanCreeCreekCroatianCrowCubanCypriotCzechCzechoslovakianDanishDelawareDominicanDutchDutch West IndianEastern EuropeanEcuadorianEgyptianEnglishEstonianEthiopianEuropeanFijianFilipinoFinnishFrenchFrench American IndianFrench CanadianGermanGerman RussianGhanaianGreekGuamanian/ChamorroGuatemalanGuyaneseHaitianHmongHonduranHopiHoumaHungarianIcelanderIndian (Asian)IndonesianInupiatIranianIraqiIrishIroquoisIsraeliItalianJamaicanJapaneseJordanianKenyanKiowaKoreanLaotianLatvianLebaneseLiberianLithuanianLumbeeLuxembourgerMacedonianMalaysianMalteseMarshalleseMenomineeMexicanMexican American IndianMongolianMoroccanNative HawaiianNavajoNepaleseNew ZealanderNicaraguanNigerianNorthern EuropeanNorwegianOkinawanOsageOttawaPaiutePakistaniPalestinianPanamanianParaguayanPennsylvania GermanPeruvianPimaPolishPortuguesePotawatomiPuebloPuerto RicanPuget Sound SalishRomanianRussianSalvadoranSamoanScandinavianScotch-IrishScottishSeminoleSenegaleseSerbianShoshoneSierra LeoneanSiouxSlavicSlovakSloveneSomaliSouth AfricanSouth AmericanSouth American IndianSoviet UnionSpaniardSpanishSpanish AmericanSpanish American IndianSri LankanSudaneseSwedishSwissSyrianTaiwaneseThaiTlingit-HaidaTohono O'OdhamTonganTrinidadian and TobagonianTsimshianTurkishU.S. Virgin IslanderUgandanUkrainianUruguayanUteVenezuelanVietnameseWelshWest IndianYakamaYaquiYugoslavianYumanYup'ikZimbabwean
Immigration
NonimmigrantsImmigrantsAfghanistanAfricaAlbaniaArgentinaArmeniaAsiaAustraliaAustriaBahamasBangladeshBarbadosBelarusBelgiumBelizeBoliviaBosnia and HerzegovinaBrazilBulgariaBurma/MyanmarCabo VerdeCambodiaCameroonCanadaCaribbeanCentral AmericaChileChinaColombiaCongoCosta RicaCroatiaCubaCzechoslovakiaDenmarkDominicaDominican RepublicEastern AfricaEastern AsiaEastern EuropeEcuadorEgyptEl SalvadorEnglandEritreaEthiopiaEuropeFijiFranceGermanyGhanaGreeceGrenadaGuatemalaGuyanaHaitiHondurasHong KongHungaryIndiaIndonesiaIranIraqIrelandIsraelItalyJamaicaJapanJordanKazakhstanKenyaKoreaKuwaitLaosLatin AmericaLatviaLebanonLiberiaLithuaniaMalaysiaMexicoMicronesiaMiddle AfricaMoldovaMoroccoNepalNetherlandsNicaraguaNigeriaNorth AmericaNorth MacedoniaNorthern AfricaNorthern EuropeNorwayOceaniaPakistanPanamaPeruPhilippinesPolandPortugalRomaniaRussiaSaudi ArabiaScotlandSenegalSerbiaSierra LeoneSingaporeSomaliaSouth AfricaSouth AmericaSouth Central AsiaSouth Eastern AsiaSouthern EuropeSpainSri LankaSt. Vincent and the GrenadinesSudanSwedenSwitzerlandSyriaTaiwanThailandTrinidad and TobagoTurkeyUgandaUkraineUruguayUzbekistanVenezuelaVietnamWest IndiesWestern AfricaWestern AsiaWestern EuropeYemenZaireZimbabweAzores
Subsaharan African
Race
Ancestry
AfghanAfricanAlaska NativeAlaskan AthabascanAlbanianAleutAlsatianAmericanApacheArabArapahoArgentineanArmenianAssyrian/Chaldean/SyriacAustralianAustrianBahamianBangladeshiBarbadianBasqueBelgianBelizeanBermudanBhutaneseBlackfeetBolivianBrazilianBritishBritish West IndianBulgarianBurmeseCajunCambodianCanadianCape VerdeanCarpatho RusynCelticCentral AmericanCentral American IndianCherokeeCheyenneChickasawChileanChineseChippewaChoctawColombianColvilleComancheCosta RicanCreeCreekCroatianCrowCubanCypriotCzechCzechoslovakianDanishDelawareDominicanDutchDutch West IndianEastern EuropeanEcuadorianEgyptianEnglishEstonianEthiopianEuropeanFijianFilipinoFinnishFrenchFrench American IndianFrench CanadianGermanGerman RussianGhanaianGuamanian/ChamorroGuatemalanGuyaneseHaitianHmongHonduranHopiHoumaHungarianIcelanderIndian (Asian)IndonesianInupiatIranianIraqiIrishIroquoisIsraeliItalianJamaicanJapaneseJordanianKenyanKiowaKoreanLaotianLatvianLebaneseLiberianLithuanianLumbeeLuxembourgerMacedonianMalaysianMalteseMarshalleseMenomineeMexicanMexican American IndianMongolianMoroccanNative HawaiianNavajoNepaleseNew ZealanderNicaraguanNigerianNorthern EuropeanNorwegianOkinawanOsageOttawaPaiutePakistaniPalestinianPanamanianParaguayanPennsylvania GermanPeruvianPimaPolishPortuguesePotawatomiPuebloPuerto RicanPuget Sound SalishRomanianRussianSalvadoranSamoanScandinavianScotch-IrishScottishSeminoleSenegaleseSerbianShoshoneSierra LeoneanSiouxSlavicSlovakSloveneSomaliSouth AfricanSouth AmericanSouth American IndianSoviet UnionSpaniardSpanishSpanish AmericanSpanish American IndianSri LankanSubsaharan AfricanSudaneseSwedishSwissSyrianTaiwaneseThaiTlingit-HaidaTohono O'OdhamTonganTrinidadian and TobagonianTsimshianTurkishU.S. Virgin IslanderUgandanUkrainianUruguayanUteVenezuelanVietnameseWelshWest IndianYakamaYaquiYugoslavianYumanYup'ikZimbabwean
Immigration
NonimmigrantsImmigrantsAfghanistanAfricaAlbaniaArgentinaArmeniaAsiaAustraliaAustriaBahamasBangladeshBarbadosBelarusBelgiumBelizeBoliviaBosnia and HerzegovinaBrazilBulgariaBurma/MyanmarCabo VerdeCambodiaCameroonCanadaCaribbeanCentral AmericaChileChinaColombiaCongoCosta RicaCroatiaCubaCzechoslovakiaDenmarkDominicaDominican RepublicEastern AfricaEastern AsiaEastern EuropeEcuadorEgyptEl SalvadorEnglandEritreaEthiopiaEuropeFijiFranceGermanyGhanaGreeceGrenadaGuatemalaGuyanaHaitiHondurasHong KongHungaryIndiaIndonesiaIranIraqIrelandIsraelItalyJamaicaJapanJordanKazakhstanKenyaKoreaKuwaitLaosLatin AmericaLatviaLebanonLiberiaLithuaniaMalaysiaMexicoMicronesiaMiddle AfricaMoldovaMoroccoNepalNetherlandsNicaraguaNigeriaNorth AmericaNorth MacedoniaNorthern AfricaNorthern EuropeNorwayOceaniaPakistanPanamaPeruPhilippinesPolandPortugalRomaniaRussiaSaudi ArabiaScotlandSenegalSerbiaSierra LeoneSingaporeSomaliaSouth AfricaSouth AmericaSouth Central AsiaSouth Eastern AsiaSouthern EuropeSpainSri LankaSt. Vincent and the GrenadinesSudanSwedenSwitzerlandSyriaTaiwanThailandTrinidad and TobagoTurkeyUgandaUkraineUruguayUzbekistanVenezuelaVietnamWest IndiesWestern AfricaWestern AsiaWestern EuropeYemenZaireZimbabweAzores
Bachelor's Degree
Income
Poverty
Unemployment
Labor Participation
Family Structure
Vehicle Availability
Education Level
Disability

Bachelor's Degree Comparison

Greeks

Sub-Saharan Africans

Exceptional
Tragic
42.0%
BACHELOR'S DEGREE
99.0/ 100
METRIC RATING
89th/ 347
METRIC RANK
35.8%
BACHELOR'S DEGREE
9.8/ 100
METRIC RATING
218th/ 347
METRIC RANK

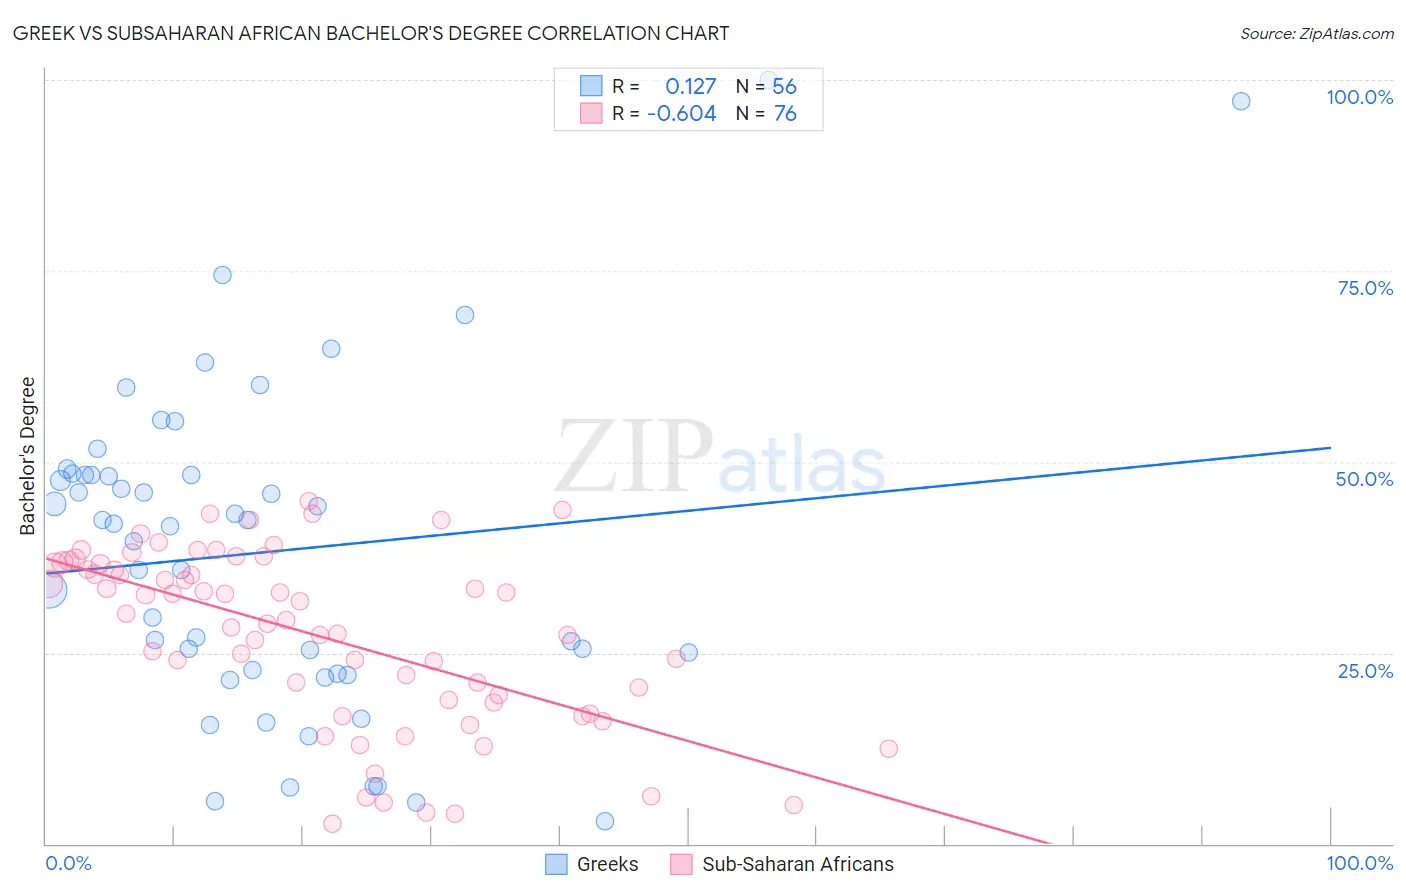
Greek vs Subsaharan African Bachelor's Degree Correlation Chart

The statistical analysis conducted on geographies consisting of 482,704,641 people shows a poor positive correlation between the proportion of Greeks and percentage of population with at least bachelor's degree education in the United States with a correlation coefficient (R) of 0.127 and weighted average of 42.0%. Similarly, the statistical analysis conducted on geographies consisting of 508,116,051 people shows a significant negative correlation between the proportion of Sub-Saharan Africans and percentage of population with at least bachelor's degree education in the United States with a correlation coefficient (R) of -0.604 and weighted average of 35.8%, a difference of 17.5%.
Greek vs Subsaharan African Bachelor's Degree

Bachelor's Degree Correlation Summary

MeasurementGreekSubsaharan African
Minimum2.9%2.6%
Maximum100.0%44.9%
Range97.1%42.3%
Mean38.2%27.3%
Median41.8%29.7%
Interquartile 25% (IQ1)22.6%18.7%
Interquartile 75% (IQ3)48.3%36.6%
Interquartile Range (IQR)25.8%17.9%
Standard Deviation (Sample)21.1%11.5%
Standard Deviation (Population)20.9%11.4%

Similar Demographics by Bachelor's Degree

Demographics Similar to Greeks by Bachelor's Degree

In terms of bachelor's degree, the demographic groups most similar to Greeks are Immigrants from Western Europe (42.0%, a difference of 0.0%), Carpatho Rusyn (42.1%, a difference of 0.12%), Laotian (42.0%, a difference of 0.12%), Immigrants from Northern Africa (41.9%, a difference of 0.22%), and Maltese (41.9%, a difference of 0.30%).
DemographicsRating | RankBachelor's Degree
Immigrants | Scotland
99.2
/100
|
#82
Exceptional
42.3%
Armenians
99.2
/100
|
#83
Exceptional
42.3%
Immigrants | Western Asia
99.2
/100
|
#84
Exceptional
42.3%
Lithuanians
99.2
/100
|
#85
Exceptional
42.2%
Immigrants | Brazil
99.2
/100
|
#86
Exceptional
42.2%
Carpatho Rusyns
99.0
/100
|
#87
Exceptional
42.1%
Immigrants | Western Europe
99.0
/100
|
#88
Exceptional
42.0%
Greeks
99.0
/100
|
#89
Exceptional
42.0%
Laotians
98.9
/100
|
#90
Exceptional
42.0%
Immigrants | Northern Africa
98.9
/100
|
#91
Exceptional
41.9%
Maltese
98.8
/100
|
#92
Exceptional
41.9%
Immigrants | Canada
98.6
/100
|
#93
Exceptional
41.7%
Immigrants | Nepal
98.6
/100
|
#94
Exceptional
41.7%
Immigrants | North America
98.5
/100
|
#95
Exceptional
41.7%
Immigrants | Moldova
98.4
/100
|
#96
Exceptional
41.6%

Demographics Similar to Sub-Saharan Africans by Bachelor's Degree

In terms of bachelor's degree, the demographic groups most similar to Sub-Saharan Africans are West Indian (35.8%, a difference of 0.030%), Spanish (35.8%, a difference of 0.070%), German Russian (35.8%, a difference of 0.10%), Dutch (35.7%, a difference of 0.18%), and Trinidadian and Tobagonian (35.7%, a difference of 0.32%).
DemographicsRating | RankBachelor's Degree
Scotch-Irish
18.3
/100
|
#211
Poor
36.4%
Immigrants | Philippines
17.8
/100
|
#212
Poor
36.4%
Immigrants | Panama
14.2
/100
|
#213
Poor
36.2%
Germans
13.9
/100
|
#214
Poor
36.1%
Immigrants | Western Africa
13.8
/100
|
#215
Poor
36.1%
Barbadians
13.5
/100
|
#216
Poor
36.1%
German Russians
10.2
/100
|
#217
Poor
35.8%
Sub-Saharan Africans
9.8
/100
|
#218
Tragic
35.8%
West Indians
9.7
/100
|
#219
Tragic
35.8%
Spanish
9.6
/100
|
#220
Tragic
35.8%
Dutch
9.2
/100
|
#221
Tragic
35.7%
Trinidadians and Tobagonians
8.8
/100
|
#222
Tragic
35.7%
French Canadians
8.3
/100
|
#223
Tragic
35.6%
Immigrants | Barbados
7.5
/100
|
#224
Tragic
35.5%
Immigrants | Burma/Myanmar
7.3
/100
|
#225
Tragic
35.5%