Greek vs Subsaharan African 2nd Grade
COMPARE
Greek
Subsaharan African
2nd Grade
2nd Grade Comparison
Greeks
Sub-Saharan Africans
98.3%
2ND GRADE
99.8/ 100
METRIC RATING
62nd/ 347
METRIC RANK
97.6%
2ND GRADE
3.4/ 100
METRIC RATING
228th/ 347
METRIC RANK
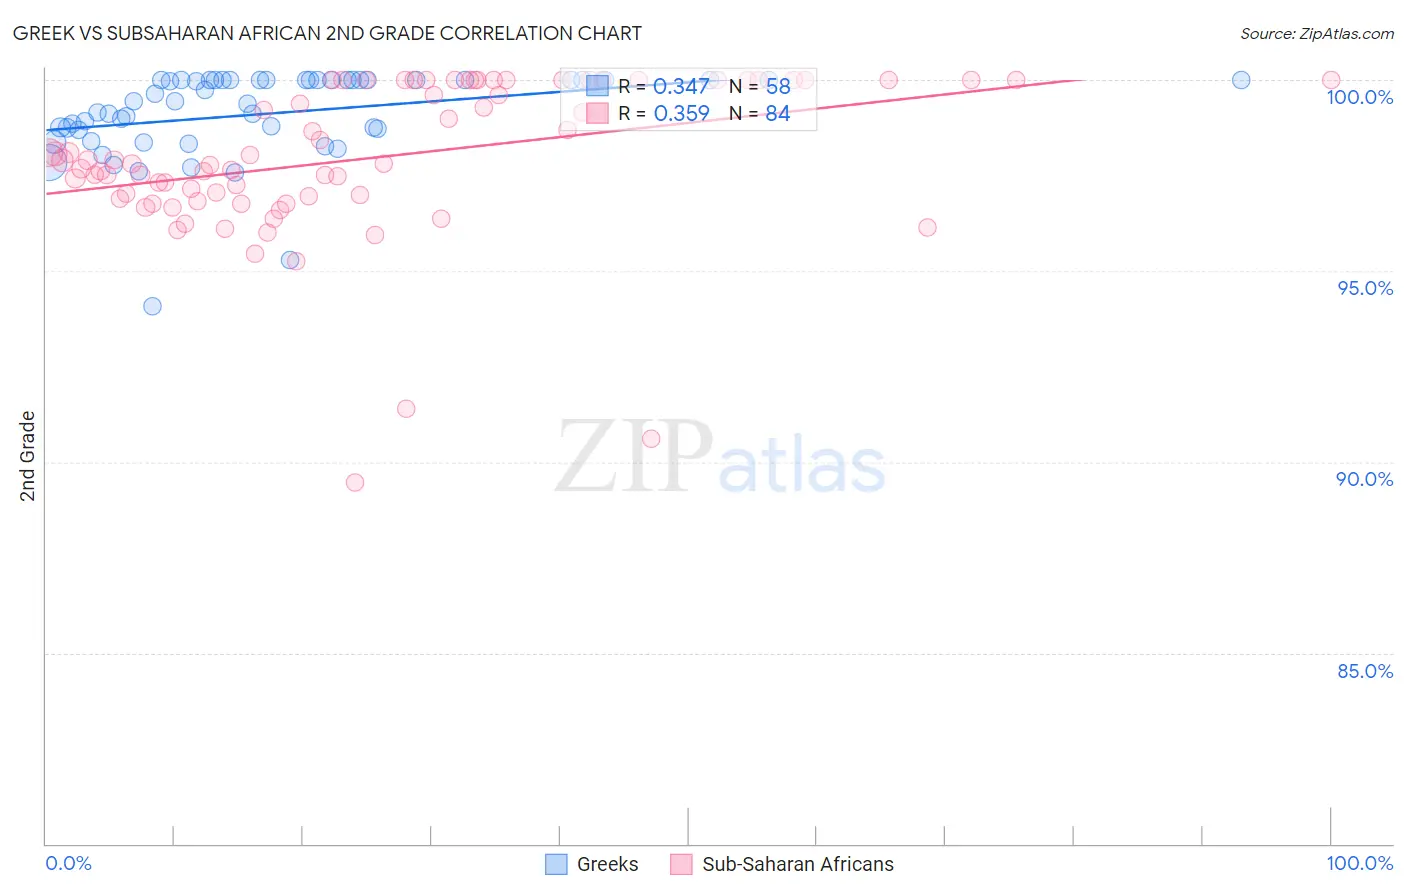
Greek vs Subsaharan African 2nd Grade Correlation Chart
The statistical analysis conducted on geographies consisting of 482,775,358 people shows a mild positive correlation between the proportion of Greeks and percentage of population with at least 2nd grade education in the United States with a correlation coefficient (R) of 0.347 and weighted average of 98.3%. Similarly, the statistical analysis conducted on geographies consisting of 508,209,936 people shows a mild positive correlation between the proportion of Sub-Saharan Africans and percentage of population with at least 2nd grade education in the United States with a correlation coefficient (R) of 0.359 and weighted average of 97.6%, a difference of 0.74%.
2nd Grade Correlation Summary
| Measurement | Greek | Subsaharan African |
| Minimum | 94.1% | 89.5% |
| Maximum | 100.0% | 100.0% |
| Range | 5.9% | 10.5% |
| Mean | 99.1% | 98.0% |
| Median | 99.4% | 97.9% |
| Interquartile 25% (IQ1) | 98.7% | 96.9% |
| Interquartile 75% (IQ3) | 100.0% | 100.0% |
| Interquartile Range (IQR) | 1.3% | 3.1% |
| Standard Deviation (Sample) | 1.2% | 2.0% |
| Standard Deviation (Population) | 1.2% | 2.0% |
Similar Demographics by 2nd Grade
Demographics Similar to Greeks by 2nd Grade
In terms of 2nd grade, the demographic groups most similar to Greeks are Slavic (98.3%, a difference of 0.0%), Creek (98.3%, a difference of 0.0%), Immigrants from Canada (98.3%, a difference of 0.0%), Maltese (98.3%, a difference of 0.0%), and Immigrants from North America (98.3%, a difference of 0.0%).
| Demographics | Rating | Rank | 2nd Grade |
| Immigrants | Scotland | 99.8 /100 | #55 | Exceptional 98.3% |
| Americans | 99.8 /100 | #56 | Exceptional 98.3% |
| Austrians | 99.8 /100 | #57 | Exceptional 98.3% |
| Bulgarians | 99.8 /100 | #58 | Exceptional 98.3% |
| Slavs | 99.8 /100 | #59 | Exceptional 98.3% |
| Creek | 99.8 /100 | #60 | Exceptional 98.3% |
| Immigrants | Canada | 99.8 /100 | #61 | Exceptional 98.3% |
| Greeks | 99.8 /100 | #62 | Exceptional 98.3% |
| Maltese | 99.7 /100 | #63 | Exceptional 98.3% |
| Immigrants | North America | 99.7 /100 | #64 | Exceptional 98.3% |
| New Zealanders | 99.7 /100 | #65 | Exceptional 98.3% |
| Canadians | 99.7 /100 | #66 | Exceptional 98.3% |
| Immigrants | Northern Europe | 99.7 /100 | #67 | Exceptional 98.3% |
| Russians | 99.7 /100 | #68 | Exceptional 98.3% |
| Immigrants | Austria | 99.6 /100 | #69 | Exceptional 98.3% |
Demographics Similar to Sub-Saharan Africans by 2nd Grade
In terms of 2nd grade, the demographic groups most similar to Sub-Saharan Africans are Immigrants from Syria (97.6%, a difference of 0.010%), Immigrants from Nepal (97.6%, a difference of 0.010%), Immigrants from Costa Rica (97.6%, a difference of 0.010%), Senegalese (97.6%, a difference of 0.010%), and Iraqi (97.6%, a difference of 0.020%).
| Demographics | Rating | Rank | 2nd Grade |
| Iraqis | 4.6 /100 | #221 | Tragic 97.6% |
| Immigrants | Sudan | 4.5 /100 | #222 | Tragic 97.6% |
| Sierra Leoneans | 4.3 /100 | #223 | Tragic 97.6% |
| Immigrants | Zaire | 4.3 /100 | #224 | Tragic 97.6% |
| Tongans | 4.3 /100 | #225 | Tragic 97.6% |
| Immigrants | Syria | 4.0 /100 | #226 | Tragic 97.6% |
| Immigrants | Nepal | 4.0 /100 | #227 | Tragic 97.6% |
| Sub-Saharan Africans | 3.4 /100 | #228 | Tragic 97.6% |
| Immigrants | Costa Rica | 3.1 /100 | #229 | Tragic 97.6% |
| Senegalese | 3.1 /100 | #230 | Tragic 97.6% |
| Immigrants | Pakistan | 2.3 /100 | #231 | Tragic 97.6% |
| Immigrants | Western Asia | 2.1 /100 | #232 | Tragic 97.6% |
| Immigrants | Uruguay | 2.1 /100 | #233 | Tragic 97.6% |
| Immigrants | Malaysia | 2.0 /100 | #234 | Tragic 97.6% |
| Colombians | 1.9 /100 | #235 | Tragic 97.6% |