Shoshone vs Subsaharan African In Labor Force | Age 20-24
COMPARE
Shoshone
Subsaharan African
In Labor Force | Age 20-24
In Labor Force | Age 20-24 Comparison
Shoshone
Sub-Saharan Africans
76.1%
IN LABOR FORCE | AGE 20-24
97.8/ 100
METRIC RATING
100th/ 347
METRIC RANK
75.7%
IN LABOR FORCE | AGE 20-24
90.9/ 100
METRIC RATING
127th/ 347
METRIC RANK
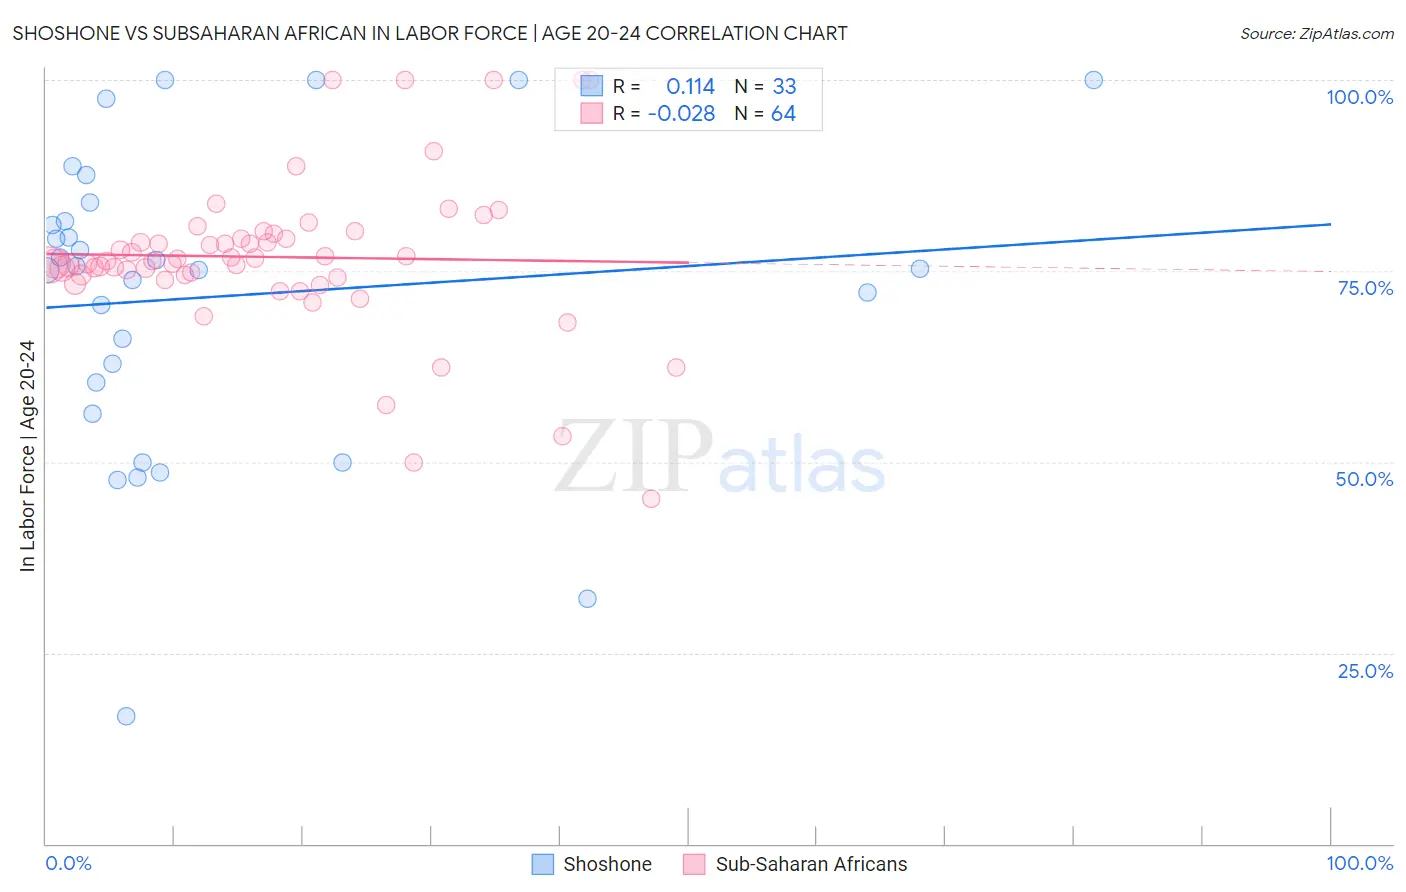
Shoshone vs Subsaharan African In Labor Force | Age 20-24 Correlation Chart
The statistical analysis conducted on geographies consisting of 66,581,429 people shows a poor positive correlation between the proportion of Shoshone and labor force participation rate among population between the ages 20 and 24 in the United States with a correlation coefficient (R) of 0.114 and weighted average of 76.1%. Similarly, the statistical analysis conducted on geographies consisting of 507,882,166 people shows no correlation between the proportion of Sub-Saharan Africans and labor force participation rate among population between the ages 20 and 24 in the United States with a correlation coefficient (R) of -0.028 and weighted average of 75.7%, a difference of 0.54%.
In Labor Force | Age 20-24 Correlation Summary
| Measurement | Shoshone | Subsaharan African |
| Minimum | 16.7% | 45.1% |
| Maximum | 100.0% | 100.0% |
| Range | 83.3% | 54.9% |
| Mean | 71.7% | 76.8% |
| Median | 75.4% | 76.3% |
| Interquartile 25% (IQ1) | 58.4% | 74.3% |
| Interquartile 75% (IQ3) | 82.8% | 79.6% |
| Interquartile Range (IQR) | 24.4% | 5.3% |
| Standard Deviation (Sample) | 19.9% | 10.3% |
| Standard Deviation (Population) | 19.6% | 10.2% |
Similar Demographics by In Labor Force | Age 20-24
Demographics Similar to Shoshone by In Labor Force | Age 20-24
In terms of in labor force | age 20-24, the demographic groups most similar to Shoshone are American (76.1%, a difference of 0.0%), Immigrants from Poland (76.1%, a difference of 0.020%), Latvian (76.1%, a difference of 0.020%), Immigrants from Lithuania (76.1%, a difference of 0.040%), and Immigrants from Oceania (76.1%, a difference of 0.040%).
| Demographics | Rating | Rank | In Labor Force | Age 20-24 |
| Hungarians | 98.9 /100 | #93 | Exceptional 76.3% |
| Potawatomi | 98.5 /100 | #94 | Exceptional 76.2% |
| Immigrants | Germany | 98.5 /100 | #95 | Exceptional 76.2% |
| Immigrants | Nonimmigrants | 98.5 /100 | #96 | Exceptional 76.2% |
| Immigrants | Lithuania | 98.0 /100 | #97 | Exceptional 76.1% |
| Immigrants | Oceania | 98.0 /100 | #98 | Exceptional 76.1% |
| Americans | 97.8 /100 | #99 | Exceptional 76.1% |
| Shoshone | 97.8 /100 | #100 | Exceptional 76.1% |
| Immigrants | Poland | 97.7 /100 | #101 | Exceptional 76.1% |
| Latvians | 97.6 /100 | #102 | Exceptional 76.1% |
| Immigrants | North Macedonia | 97.5 /100 | #103 | Exceptional 76.1% |
| Macedonians | 97.2 /100 | #104 | Exceptional 76.0% |
| Immigrants | Nepal | 97.2 /100 | #105 | Exceptional 76.0% |
| Immigrants | Uganda | 97.1 /100 | #106 | Exceptional 76.0% |
| Greeks | 96.9 /100 | #107 | Exceptional 76.0% |
Demographics Similar to Sub-Saharan Africans by In Labor Force | Age 20-24
In terms of in labor force | age 20-24, the demographic groups most similar to Sub-Saharan Africans are Immigrants from Afghanistan (75.6%, a difference of 0.060%), Iroquois (75.6%, a difference of 0.070%), Immigrants from Austria (75.6%, a difference of 0.080%), Immigrants from Jordan (75.6%, a difference of 0.090%), and Palestinian (75.6%, a difference of 0.10%).
| Demographics | Rating | Rank | In Labor Force | Age 20-24 |
| Immigrants | Africa | 94.6 /100 | #120 | Exceptional 75.8% |
| Immigrants | Serbia | 94.3 /100 | #121 | Exceptional 75.8% |
| Pakistanis | 94.1 /100 | #122 | Exceptional 75.8% |
| Immigrants | Bulgaria | 94.1 /100 | #123 | Exceptional 75.8% |
| Immigrants | Sierra Leone | 93.8 /100 | #124 | Exceptional 75.8% |
| Immigrants | Scotland | 93.7 /100 | #125 | Exceptional 75.8% |
| Brazilians | 93.0 /100 | #126 | Exceptional 75.8% |
| Sub-Saharan Africans | 90.9 /100 | #127 | Exceptional 75.7% |
| Immigrants | Afghanistan | 89.4 /100 | #128 | Excellent 75.6% |
| Iroquois | 89.1 /100 | #129 | Excellent 75.6% |
| Immigrants | Austria | 88.8 /100 | #130 | Excellent 75.6% |
| Immigrants | Jordan | 88.5 /100 | #131 | Excellent 75.6% |
| Palestinians | 88.4 /100 | #132 | Excellent 75.6% |
| Zimbabweans | 88.2 /100 | #133 | Excellent 75.6% |
| Estonians | 87.1 /100 | #134 | Excellent 75.6% |