Immigrants from Western Asia vs Osage In Labor Force | Age > 16
COMPARE
Immigrants from Western Asia
Osage
In Labor Force | Age > 16
In Labor Force | Age > 16 Comparison
Immigrants from Western Asia
Osage
65.3%
IN LABOR FORCE | AGE > 16
67.3/ 100
METRIC RATING
166th/ 347
METRIC RANK
63.5%
IN LABOR FORCE | AGE > 16
0.0/ 100
METRIC RATING
305th/ 347
METRIC RANK
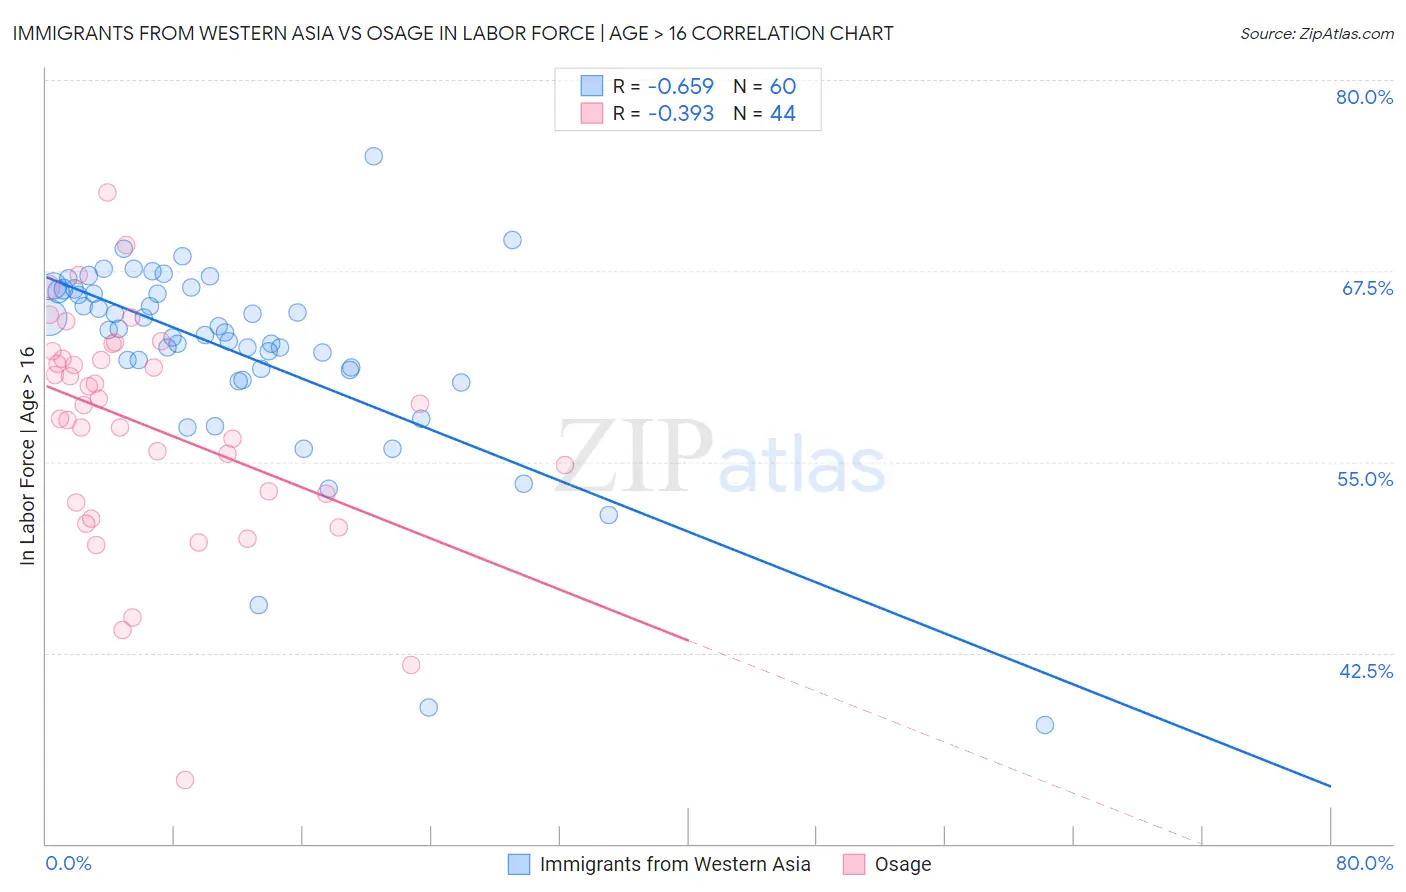
Immigrants from Western Asia vs Osage In Labor Force | Age > 16 Correlation Chart
The statistical analysis conducted on geographies consisting of 404,444,876 people shows a significant negative correlation between the proportion of Immigrants from Western Asia and labor force participation rate among population ages 16 and over in the United States with a correlation coefficient (R) of -0.659 and weighted average of 65.3%. Similarly, the statistical analysis conducted on geographies consisting of 91,805,602 people shows a mild negative correlation between the proportion of Osage and labor force participation rate among population ages 16 and over in the United States with a correlation coefficient (R) of -0.393 and weighted average of 63.5%, a difference of 2.8%.
In Labor Force | Age > 16 Correlation Summary
| Measurement | Immigrants from Western Asia | Osage |
| Minimum | 37.8% | 34.2% |
| Maximum | 75.0% | 72.7% |
| Range | 37.2% | 38.5% |
| Mean | 62.3% | 57.3% |
| Median | 63.6% | 58.8% |
| Interquartile 25% (IQ1) | 61.0% | 52.6% |
| Interquartile 75% (IQ3) | 66.2% | 62.0% |
| Interquartile Range (IQR) | 5.2% | 9.4% |
| Standard Deviation (Sample) | 6.5% | 7.5% |
| Standard Deviation (Population) | 6.5% | 7.4% |
Similar Demographics by In Labor Force | Age > 16
Demographics Similar to Immigrants from Western Asia by In Labor Force | Age > 16
In terms of in labor force | age > 16, the demographic groups most similar to Immigrants from Western Asia are Immigrants from Kazakhstan (65.3%, a difference of 0.010%), Danish (65.3%, a difference of 0.020%), Immigrants from Belarus (65.2%, a difference of 0.020%), South African (65.3%, a difference of 0.030%), and Australian (65.3%, a difference of 0.050%).
| Demographics | Rating | Rank | In Labor Force | Age > 16 |
| Immigrants | Syria | 74.6 /100 | #159 | Good 65.3% |
| Immigrants | South Africa | 73.5 /100 | #160 | Good 65.3% |
| Australians | 71.3 /100 | #161 | Good 65.3% |
| Albanians | 70.8 /100 | #162 | Good 65.3% |
| South Africans | 69.8 /100 | #163 | Good 65.3% |
| Danes | 68.8 /100 | #164 | Good 65.3% |
| Immigrants | Kazakhstan | 68.1 /100 | #165 | Good 65.3% |
| Immigrants | Western Asia | 67.3 /100 | #166 | Good 65.3% |
| Immigrants | Belarus | 66.0 /100 | #167 | Good 65.2% |
| Serbians | 63.5 /100 | #168 | Good 65.2% |
| Arabs | 62.4 /100 | #169 | Good 65.2% |
| Immigrants | Israel | 61.7 /100 | #170 | Good 65.2% |
| Israelis | 61.6 /100 | #171 | Good 65.2% |
| Immigrants | Sweden | 61.3 /100 | #172 | Good 65.2% |
| Immigrants | Ukraine | 53.7 /100 | #173 | Average 65.1% |
Demographics Similar to Osage by In Labor Force | Age > 16
In terms of in labor force | age > 16, the demographic groups most similar to Osage are Nonimmigrants (63.5%, a difference of 0.050%), Black/African American (63.4%, a difference of 0.090%), Cree (63.5%, a difference of 0.10%), Central American Indian (63.4%, a difference of 0.13%), and Delaware (63.6%, a difference of 0.14%).
| Demographics | Rating | Rank | In Labor Force | Age > 16 |
| Comanche | 0.0 /100 | #298 | Tragic 63.6% |
| Whites/Caucasians | 0.0 /100 | #299 | Tragic 63.6% |
| Immigrants | Azores | 0.0 /100 | #300 | Tragic 63.6% |
| Spanish Americans | 0.0 /100 | #301 | Tragic 63.6% |
| Delaware | 0.0 /100 | #302 | Tragic 63.6% |
| Cree | 0.0 /100 | #303 | Tragic 63.5% |
| Immigrants | Nonimmigrants | 0.0 /100 | #304 | Tragic 63.5% |
| Osage | 0.0 /100 | #305 | Tragic 63.5% |
| Blacks/African Americans | 0.0 /100 | #306 | Tragic 63.4% |
| Central American Indians | 0.0 /100 | #307 | Tragic 63.4% |
| Pennsylvania Germans | 0.0 /100 | #308 | Tragic 63.4% |
| Scotch-Irish | 0.0 /100 | #309 | Tragic 63.3% |
| Shoshone | 0.0 /100 | #310 | Tragic 63.2% |
| Blackfeet | 0.0 /100 | #311 | Tragic 63.2% |
| Iroquois | 0.0 /100 | #312 | Tragic 63.2% |