Immigrants from Nigeria vs Osage In Labor Force | Age > 16
COMPARE
Immigrants from Nigeria
Osage
In Labor Force | Age > 16
In Labor Force | Age > 16 Comparison
Immigrants from Nigeria
Osage
66.9%
IN LABOR FORCE | AGE > 16
100.0/ 100
METRIC RATING
38th/ 347
METRIC RANK
63.5%
IN LABOR FORCE | AGE > 16
0.0/ 100
METRIC RATING
305th/ 347
METRIC RANK
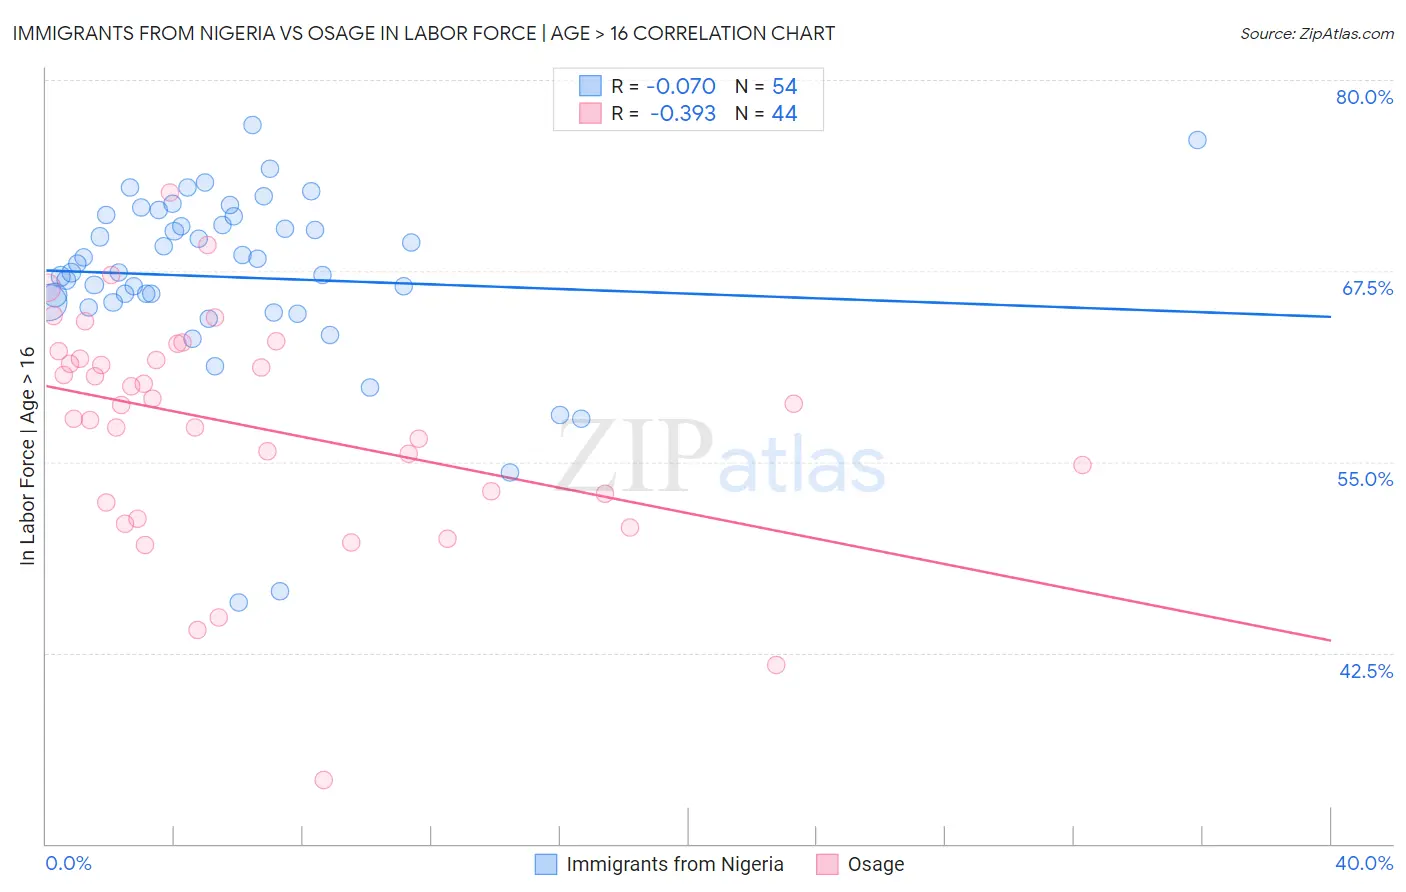
Immigrants from Nigeria vs Osage In Labor Force | Age > 16 Correlation Chart
The statistical analysis conducted on geographies consisting of 283,493,759 people shows a slight negative correlation between the proportion of Immigrants from Nigeria and labor force participation rate among population ages 16 and over in the United States with a correlation coefficient (R) of -0.070 and weighted average of 66.9%. Similarly, the statistical analysis conducted on geographies consisting of 91,805,602 people shows a mild negative correlation between the proportion of Osage and labor force participation rate among population ages 16 and over in the United States with a correlation coefficient (R) of -0.393 and weighted average of 63.5%, a difference of 5.4%.
In Labor Force | Age > 16 Correlation Summary
| Measurement | Immigrants from Nigeria | Osage |
| Minimum | 45.8% | 34.2% |
| Maximum | 77.0% | 72.7% |
| Range | 31.2% | 38.5% |
| Mean | 67.1% | 57.3% |
| Median | 67.7% | 58.8% |
| Interquartile 25% (IQ1) | 65.4% | 52.6% |
| Interquartile 75% (IQ3) | 71.1% | 62.0% |
| Interquartile Range (IQR) | 5.7% | 9.4% |
| Standard Deviation (Sample) | 6.1% | 7.5% |
| Standard Deviation (Population) | 6.0% | 7.4% |
Similar Demographics by In Labor Force | Age > 16
Demographics Similar to Immigrants from Nigeria by In Labor Force | Age > 16
In terms of in labor force | age > 16, the demographic groups most similar to Immigrants from Nigeria are Immigrants from Afghanistan (67.0%, a difference of 0.12%), Salvadoran (66.8%, a difference of 0.16%), Immigrants from El Salvador (66.8%, a difference of 0.17%), Immigrants from Zimbabwe (66.8%, a difference of 0.17%), and Immigrants from South Central Asia (67.1%, a difference of 0.20%).
| Demographics | Rating | Rank | In Labor Force | Age > 16 |
| Ghanaians | 100.0 /100 | #31 | Exceptional 67.1% |
| Immigrants | Congo | 100.0 /100 | #32 | Exceptional 67.1% |
| Afghans | 100.0 /100 | #33 | Exceptional 67.1% |
| Immigrants | Ghana | 100.0 /100 | #34 | Exceptional 67.1% |
| Immigrants | South Central Asia | 100.0 /100 | #35 | Exceptional 67.1% |
| Immigrants | Western Africa | 100.0 /100 | #36 | Exceptional 67.1% |
| Immigrants | Afghanistan | 100.0 /100 | #37 | Exceptional 67.0% |
| Immigrants | Nigeria | 100.0 /100 | #38 | Exceptional 66.9% |
| Salvadorans | 100.0 /100 | #39 | Exceptional 66.8% |
| Immigrants | El Salvador | 100.0 /100 | #40 | Exceptional 66.8% |
| Immigrants | Zimbabwe | 100.0 /100 | #41 | Exceptional 66.8% |
| Senegalese | 100.0 /100 | #42 | Exceptional 66.7% |
| Luxembourgers | 100.0 /100 | #43 | Exceptional 66.7% |
| Immigrants | Pakistan | 100.0 /100 | #44 | Exceptional 66.7% |
| Immigrants | Brazil | 100.0 /100 | #45 | Exceptional 66.7% |
Demographics Similar to Osage by In Labor Force | Age > 16
In terms of in labor force | age > 16, the demographic groups most similar to Osage are Nonimmigrants (63.5%, a difference of 0.050%), Black/African American (63.4%, a difference of 0.090%), Cree (63.5%, a difference of 0.10%), Central American Indian (63.4%, a difference of 0.13%), and Delaware (63.6%, a difference of 0.14%).
| Demographics | Rating | Rank | In Labor Force | Age > 16 |
| Comanche | 0.0 /100 | #298 | Tragic 63.6% |
| Whites/Caucasians | 0.0 /100 | #299 | Tragic 63.6% |
| Immigrants | Azores | 0.0 /100 | #300 | Tragic 63.6% |
| Spanish Americans | 0.0 /100 | #301 | Tragic 63.6% |
| Delaware | 0.0 /100 | #302 | Tragic 63.6% |
| Cree | 0.0 /100 | #303 | Tragic 63.5% |
| Immigrants | Nonimmigrants | 0.0 /100 | #304 | Tragic 63.5% |
| Osage | 0.0 /100 | #305 | Tragic 63.5% |
| Blacks/African Americans | 0.0 /100 | #306 | Tragic 63.4% |
| Central American Indians | 0.0 /100 | #307 | Tragic 63.4% |
| Pennsylvania Germans | 0.0 /100 | #308 | Tragic 63.4% |
| Scotch-Irish | 0.0 /100 | #309 | Tragic 63.3% |
| Shoshone | 0.0 /100 | #310 | Tragic 63.2% |
| Blackfeet | 0.0 /100 | #311 | Tragic 63.2% |
| Iroquois | 0.0 /100 | #312 | Tragic 63.2% |