Ute vs Immigrants from Greece In Labor Force | Age 20-24
COMPARE
Ute
Immigrants from Greece
In Labor Force | Age 20-24
In Labor Force | Age 20-24 Comparison
Ute
Immigrants from Greece
73.8%
IN LABOR FORCE | AGE 20-24
1.0/ 100
METRIC RATING
254th/ 347
METRIC RANK
74.2%
IN LABOR FORCE | AGE 20-24
4.1/ 100
METRIC RATING
231st/ 347
METRIC RANK
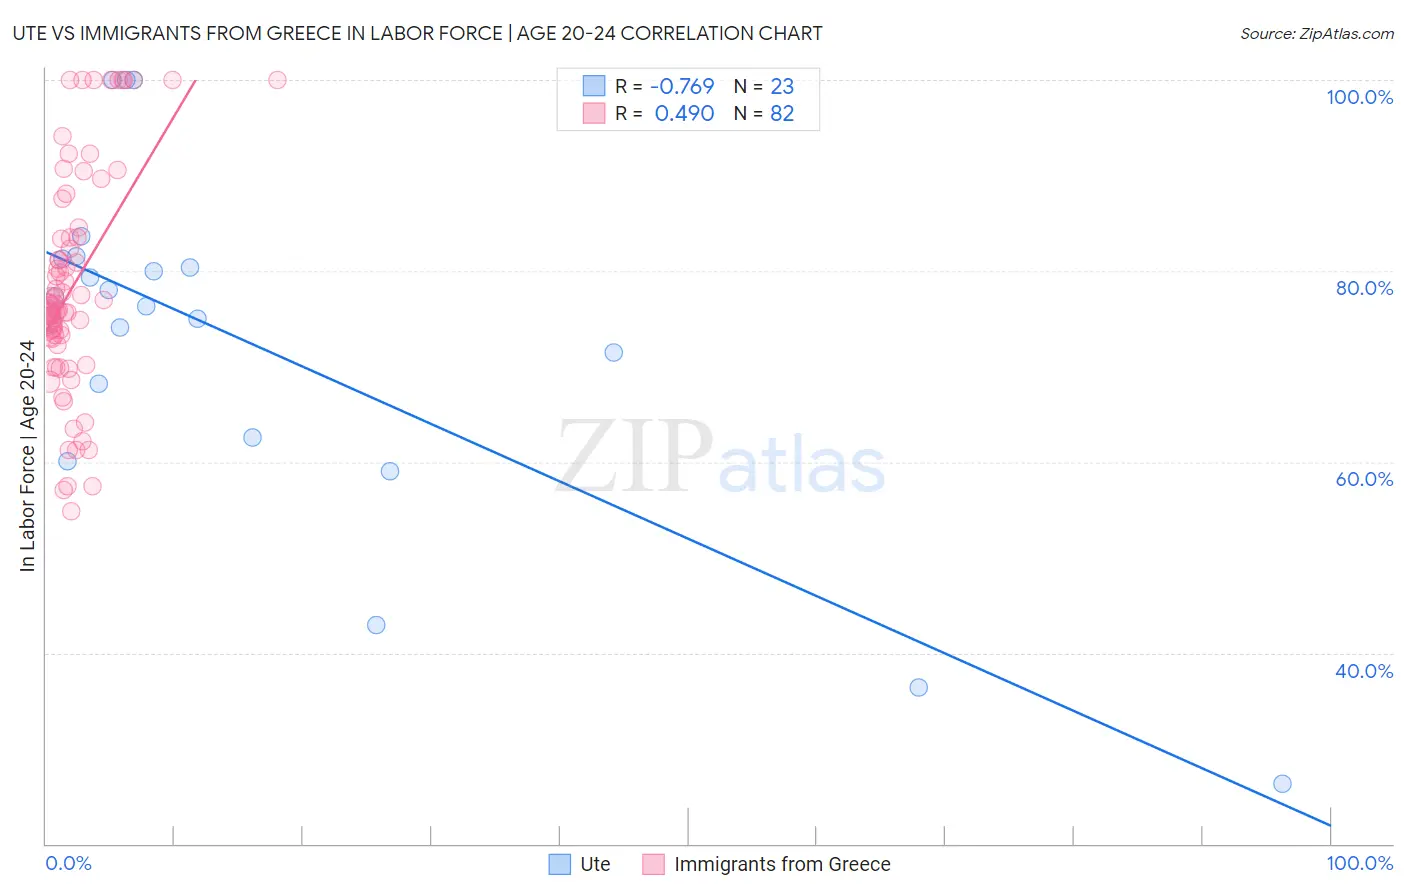
Ute vs Immigrants from Greece In Labor Force | Age 20-24 Correlation Chart
The statistical analysis conducted on geographies consisting of 55,663,255 people shows a strong negative correlation between the proportion of Ute and labor force participation rate among population between the ages 20 and 24 in the United States with a correlation coefficient (R) of -0.769 and weighted average of 73.8%. Similarly, the statistical analysis conducted on geographies consisting of 216,782,866 people shows a moderate positive correlation between the proportion of Immigrants from Greece and labor force participation rate among population between the ages 20 and 24 in the United States with a correlation coefficient (R) of 0.490 and weighted average of 74.2%, a difference of 0.54%.
In Labor Force | Age 20-24 Correlation Summary
| Measurement | Ute | Immigrants from Greece |
| Minimum | 26.3% | 54.8% |
| Maximum | 100.0% | 100.0% |
| Range | 73.7% | 45.2% |
| Mean | 72.5% | 78.4% |
| Median | 76.4% | 76.1% |
| Interquartile 25% (IQ1) | 62.5% | 72.9% |
| Interquartile 75% (IQ3) | 81.3% | 83.5% |
| Interquartile Range (IQR) | 18.8% | 10.6% |
| Standard Deviation (Sample) | 18.6% | 11.6% |
| Standard Deviation (Population) | 18.1% | 11.5% |
Similar Demographics by In Labor Force | Age 20-24
Demographics Similar to Ute by In Labor Force | Age 20-24
In terms of in labor force | age 20-24, the demographic groups most similar to Ute are Arapaho (73.8%, a difference of 0.0%), Immigrants from Pakistan (73.8%, a difference of 0.020%), Immigrants from Kazakhstan (73.8%, a difference of 0.050%), Immigrants from Egypt (73.8%, a difference of 0.070%), and Spanish American Indian (73.7%, a difference of 0.070%).
| Demographics | Rating | Rank | In Labor Force | Age 20-24 |
| Colville | 1.5 /100 | #247 | Tragic 73.9% |
| Immigrants | Saudi Arabia | 1.5 /100 | #248 | Tragic 73.9% |
| Blacks/African Americans | 1.3 /100 | #249 | Tragic 73.9% |
| Immigrants | Belgium | 1.3 /100 | #250 | Tragic 73.9% |
| Immigrants | Egypt | 1.2 /100 | #251 | Tragic 73.8% |
| Immigrants | Kazakhstan | 1.1 /100 | #252 | Tragic 73.8% |
| Arapaho | 1.0 /100 | #253 | Tragic 73.8% |
| Ute | 1.0 /100 | #254 | Tragic 73.8% |
| Immigrants | Pakistan | 0.9 /100 | #255 | Tragic 73.8% |
| Spanish American Indians | 0.8 /100 | #256 | Tragic 73.7% |
| Paraguayans | 0.8 /100 | #257 | Tragic 73.7% |
| Egyptians | 0.7 /100 | #258 | Tragic 73.7% |
| Dutch West Indians | 0.7 /100 | #259 | Tragic 73.7% |
| Immigrants | Turkey | 0.7 /100 | #260 | Tragic 73.7% |
| Houma | 0.6 /100 | #261 | Tragic 73.7% |
Demographics Similar to Immigrants from Greece by In Labor Force | Age 20-24
In terms of in labor force | age 20-24, the demographic groups most similar to Immigrants from Greece are Immigrants from Switzerland (74.2%, a difference of 0.010%), Immigrants from Albania (74.2%, a difference of 0.020%), Immigrants from Sweden (74.2%, a difference of 0.040%), Immigrants from Chile (74.1%, a difference of 0.050%), and Immigrants (74.1%, a difference of 0.060%).
| Demographics | Rating | Rank | In Labor Force | Age 20-24 |
| Seminole | 6.9 /100 | #224 | Tragic 74.3% |
| Ghanaians | 6.2 /100 | #225 | Tragic 74.3% |
| Immigrants | Fiji | 5.9 /100 | #226 | Tragic 74.3% |
| Immigrants | Ireland | 5.8 /100 | #227 | Tragic 74.3% |
| Immigrants | Ukraine | 5.1 /100 | #228 | Tragic 74.2% |
| Immigrants | Sweden | 4.6 /100 | #229 | Tragic 74.2% |
| Immigrants | Albania | 4.3 /100 | #230 | Tragic 74.2% |
| Immigrants | Greece | 4.1 /100 | #231 | Tragic 74.2% |
| Immigrants | Switzerland | 4.1 /100 | #232 | Tragic 74.2% |
| Immigrants | Chile | 3.7 /100 | #233 | Tragic 74.1% |
| Immigrants | Immigrants | 3.6 /100 | #234 | Tragic 74.1% |
| Laotians | 3.5 /100 | #235 | Tragic 74.1% |
| Immigrants | France | 3.3 /100 | #236 | Tragic 74.1% |
| Bermudans | 3.2 /100 | #237 | Tragic 74.1% |
| Immigrants | Japan | 3.0 /100 | #238 | Tragic 74.1% |