Immigrants from Panama vs Immigrants from Greece In Labor Force | Age 20-24
COMPARE
Immigrants from Panama
Immigrants from Greece
In Labor Force | Age 20-24
In Labor Force | Age 20-24 Comparison
Immigrants from Panama
Immigrants from Greece
73.9%
IN LABOR FORCE | AGE 20-24
1.6/ 100
METRIC RATING
246th/ 347
METRIC RANK
74.2%
IN LABOR FORCE | AGE 20-24
4.1/ 100
METRIC RATING
231st/ 347
METRIC RANK
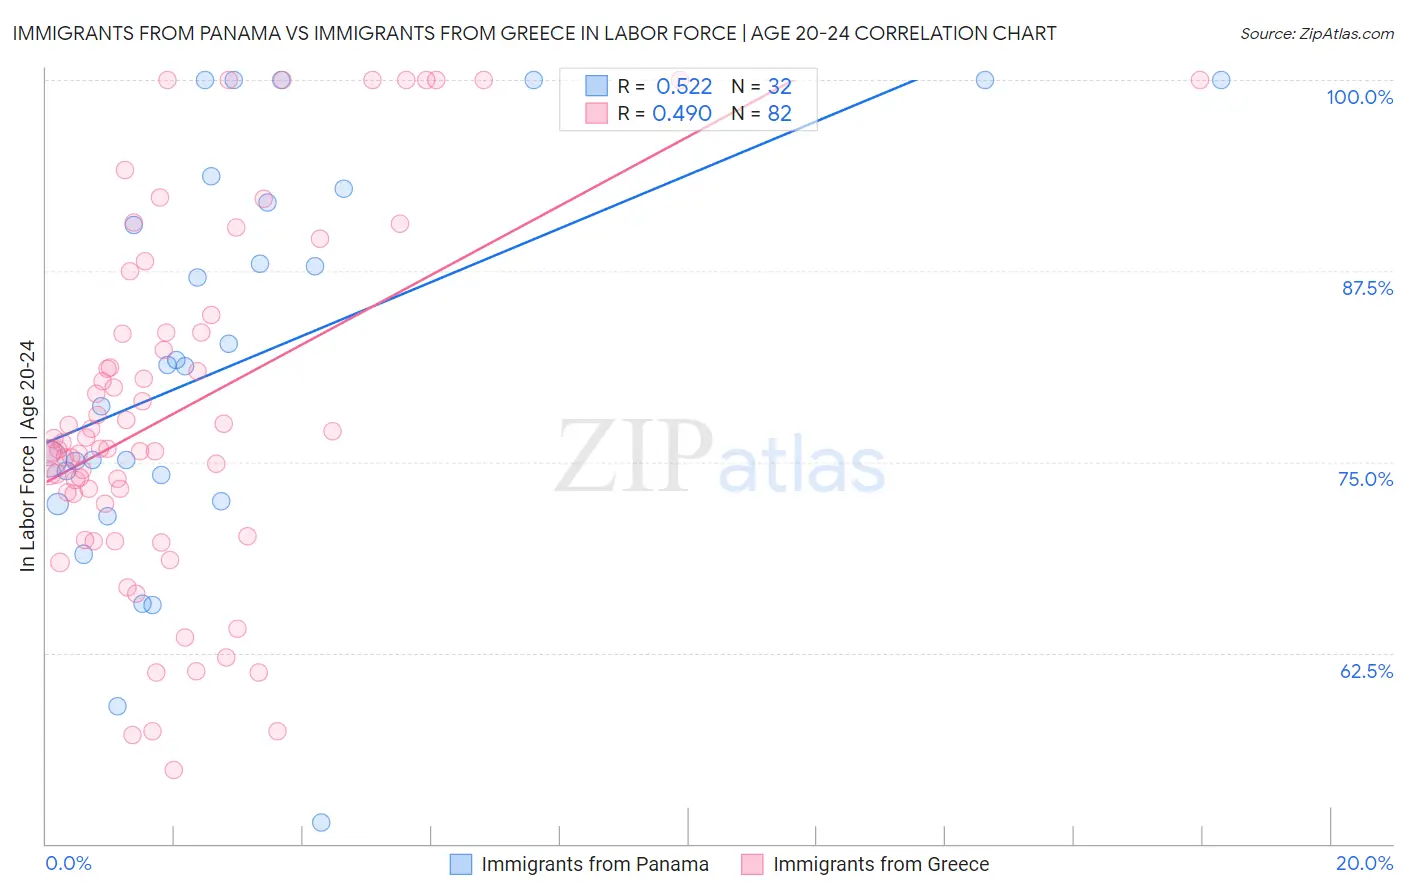
Immigrants from Panama vs Immigrants from Greece In Labor Force | Age 20-24 Correlation Chart
The statistical analysis conducted on geographies consisting of 221,162,979 people shows a substantial positive correlation between the proportion of Immigrants from Panama and labor force participation rate among population between the ages 20 and 24 in the United States with a correlation coefficient (R) of 0.522 and weighted average of 73.9%. Similarly, the statistical analysis conducted on geographies consisting of 216,782,866 people shows a moderate positive correlation between the proportion of Immigrants from Greece and labor force participation rate among population between the ages 20 and 24 in the United States with a correlation coefficient (R) of 0.490 and weighted average of 74.2%, a difference of 0.37%.
In Labor Force | Age 20-24 Correlation Summary
| Measurement | Immigrants from Panama | Immigrants from Greece |
| Minimum | 51.4% | 54.8% |
| Maximum | 100.0% | 100.0% |
| Range | 48.6% | 45.2% |
| Mean | 81.7% | 78.4% |
| Median | 81.3% | 76.1% |
| Interquartile 25% (IQ1) | 73.3% | 72.9% |
| Interquartile 75% (IQ3) | 92.4% | 83.5% |
| Interquartile Range (IQR) | 19.2% | 10.6% |
| Standard Deviation (Sample) | 13.0% | 11.6% |
| Standard Deviation (Population) | 12.8% | 11.5% |
Demographics Similar to Immigrants from Panama and Immigrants from Greece by In Labor Force | Age 20-24
In terms of in labor force | age 20-24, the demographic groups most similar to Immigrants from Panama are Colville (73.9%, a difference of 0.030%), Immigrants from Saudi Arabia (73.9%, a difference of 0.030%), Turkish (73.9%, a difference of 0.040%), Immigrants from South Central Asia (74.0%, a difference of 0.060%), and Immigrants from Syria (74.0%, a difference of 0.070%). Similarly, the demographic groups most similar to Immigrants from Greece are Immigrants from Switzerland (74.2%, a difference of 0.010%), Immigrants from Albania (74.2%, a difference of 0.020%), Immigrants from Sweden (74.2%, a difference of 0.040%), Immigrants from Chile (74.1%, a difference of 0.050%), and Immigrants (74.1%, a difference of 0.060%).
| Demographics | Rating | Rank | In Labor Force | Age 20-24 |
| Immigrants | Ukraine | 5.1 /100 | #228 | Tragic 74.2% |
| Immigrants | Sweden | 4.6 /100 | #229 | Tragic 74.2% |
| Immigrants | Albania | 4.3 /100 | #230 | Tragic 74.2% |
| Immigrants | Greece | 4.1 /100 | #231 | Tragic 74.2% |
| Immigrants | Switzerland | 4.1 /100 | #232 | Tragic 74.2% |
| Immigrants | Chile | 3.7 /100 | #233 | Tragic 74.1% |
| Immigrants | Immigrants | 3.6 /100 | #234 | Tragic 74.1% |
| Laotians | 3.5 /100 | #235 | Tragic 74.1% |
| Immigrants | France | 3.3 /100 | #236 | Tragic 74.1% |
| Bermudans | 3.2 /100 | #237 | Tragic 74.1% |
| Immigrants | Japan | 3.0 /100 | #238 | Tragic 74.1% |
| Immigrants | Latin America | 2.7 /100 | #239 | Tragic 74.1% |
| Immigrants | Sri Lanka | 2.3 /100 | #240 | Tragic 74.0% |
| Immigrants | Senegal | 2.1 /100 | #241 | Tragic 74.0% |
| Thais | 2.1 /100 | #242 | Tragic 74.0% |
| Immigrants | Syria | 1.9 /100 | #243 | Tragic 74.0% |
| Immigrants | South Central Asia | 1.9 /100 | #244 | Tragic 74.0% |
| Turks | 1.8 /100 | #245 | Tragic 73.9% |
| Immigrants | Panama | 1.6 /100 | #246 | Tragic 73.9% |
| Colville | 1.5 /100 | #247 | Tragic 73.9% |
| Immigrants | Saudi Arabia | 1.5 /100 | #248 | Tragic 73.9% |