Paiute vs Immigrants from Greece In Labor Force | Age 20-24
COMPARE
Paiute
Immigrants from Greece
In Labor Force | Age 20-24
In Labor Force | Age 20-24 Comparison
Paiute
Immigrants from Greece
75.3%
IN LABOR FORCE | AGE 20-24
74.1/ 100
METRIC RATING
151st/ 347
METRIC RANK
74.2%
IN LABOR FORCE | AGE 20-24
4.1/ 100
METRIC RATING
231st/ 347
METRIC RANK
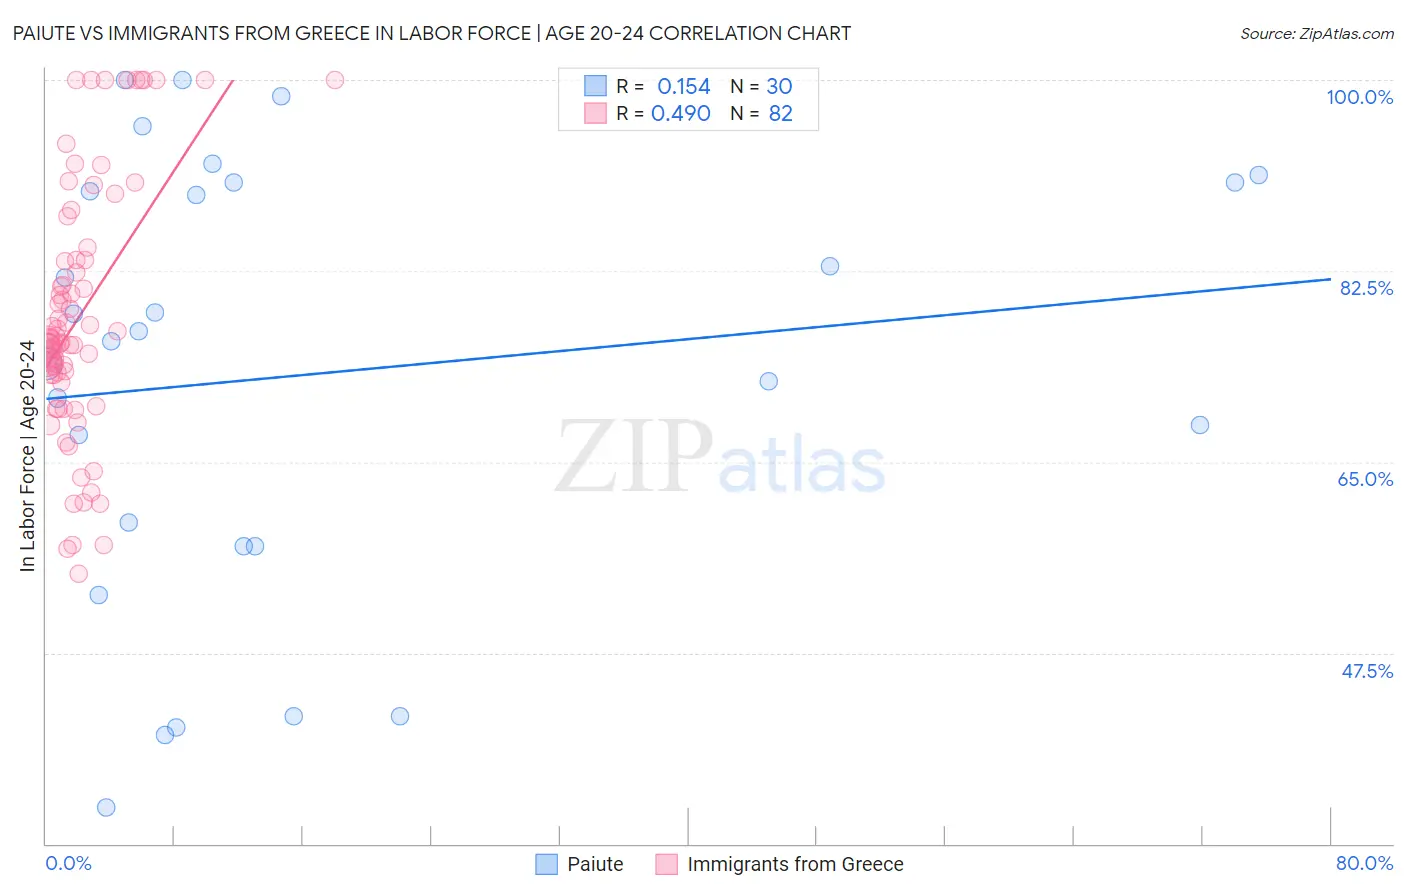
Paiute vs Immigrants from Greece In Labor Force | Age 20-24 Correlation Chart
The statistical analysis conducted on geographies consisting of 58,387,472 people shows a poor positive correlation between the proportion of Paiute and labor force participation rate among population between the ages 20 and 24 in the United States with a correlation coefficient (R) of 0.154 and weighted average of 75.3%. Similarly, the statistical analysis conducted on geographies consisting of 216,782,866 people shows a moderate positive correlation between the proportion of Immigrants from Greece and labor force participation rate among population between the ages 20 and 24 in the United States with a correlation coefficient (R) of 0.490 and weighted average of 74.2%, a difference of 1.5%.
In Labor Force | Age 20-24 Correlation Summary
| Measurement | Paiute | Immigrants from Greece |
| Minimum | 33.3% | 54.8% |
| Maximum | 100.0% | 100.0% |
| Range | 66.7% | 45.2% |
| Mean | 73.0% | 78.4% |
| Median | 76.5% | 76.1% |
| Interquartile 25% (IQ1) | 57.3% | 72.9% |
| Interquartile 75% (IQ3) | 90.6% | 83.5% |
| Interquartile Range (IQR) | 33.3% | 10.6% |
| Standard Deviation (Sample) | 20.0% | 11.6% |
| Standard Deviation (Population) | 19.7% | 11.5% |
Similar Demographics by In Labor Force | Age 20-24
Demographics Similar to Paiute by In Labor Force | Age 20-24
In terms of in labor force | age 20-24, the demographic groups most similar to Paiute are Salvadoran (75.3%, a difference of 0.010%), Lebanese (75.3%, a difference of 0.010%), Guatemalan (75.3%, a difference of 0.030%), Osage (75.3%, a difference of 0.030%), and Ugandan (75.4%, a difference of 0.040%).
| Demographics | Rating | Rank | In Labor Force | Age 20-24 |
| Bhutanese | 80.8 /100 | #144 | Excellent 75.4% |
| Koreans | 79.7 /100 | #145 | Good 75.4% |
| Mexican American Indians | 78.8 /100 | #146 | Good 75.4% |
| Comanche | 77.6 /100 | #147 | Good 75.4% |
| Immigrants | Cambodia | 76.7 /100 | #148 | Good 75.4% |
| Ugandans | 76.1 /100 | #149 | Good 75.4% |
| Salvadorans | 74.8 /100 | #150 | Good 75.3% |
| Paiute | 74.1 /100 | #151 | Good 75.3% |
| Lebanese | 73.5 /100 | #152 | Good 75.3% |
| Guatemalans | 72.3 /100 | #153 | Good 75.3% |
| Osage | 72.3 /100 | #154 | Good 75.3% |
| Immigrants | Guatemala | 71.9 /100 | #155 | Good 75.3% |
| Immigrants | El Salvador | 71.7 /100 | #156 | Good 75.3% |
| Immigrants | Western Europe | 71.5 /100 | #157 | Good 75.3% |
| Immigrants | Bolivia | 71.0 /100 | #158 | Good 75.3% |
Demographics Similar to Immigrants from Greece by In Labor Force | Age 20-24
In terms of in labor force | age 20-24, the demographic groups most similar to Immigrants from Greece are Immigrants from Switzerland (74.2%, a difference of 0.010%), Immigrants from Albania (74.2%, a difference of 0.020%), Immigrants from Sweden (74.2%, a difference of 0.040%), Immigrants from Chile (74.1%, a difference of 0.050%), and Immigrants (74.1%, a difference of 0.060%).
| Demographics | Rating | Rank | In Labor Force | Age 20-24 |
| Seminole | 6.9 /100 | #224 | Tragic 74.3% |
| Ghanaians | 6.2 /100 | #225 | Tragic 74.3% |
| Immigrants | Fiji | 5.9 /100 | #226 | Tragic 74.3% |
| Immigrants | Ireland | 5.8 /100 | #227 | Tragic 74.3% |
| Immigrants | Ukraine | 5.1 /100 | #228 | Tragic 74.2% |
| Immigrants | Sweden | 4.6 /100 | #229 | Tragic 74.2% |
| Immigrants | Albania | 4.3 /100 | #230 | Tragic 74.2% |
| Immigrants | Greece | 4.1 /100 | #231 | Tragic 74.2% |
| Immigrants | Switzerland | 4.1 /100 | #232 | Tragic 74.2% |
| Immigrants | Chile | 3.7 /100 | #233 | Tragic 74.1% |
| Immigrants | Immigrants | 3.6 /100 | #234 | Tragic 74.1% |
| Laotians | 3.5 /100 | #235 | Tragic 74.1% |
| Immigrants | France | 3.3 /100 | #236 | Tragic 74.1% |
| Bermudans | 3.2 /100 | #237 | Tragic 74.1% |
| Immigrants | Japan | 3.0 /100 | #238 | Tragic 74.1% |