Immigrants from Sweden vs Slavic In Labor Force | Age > 16
COMPARE
Immigrants from Sweden
Slavic
In Labor Force | Age > 16
In Labor Force | Age > 16 Comparison
Immigrants from Sweden
Slavs
65.2%
IN LABOR FORCE | AGE > 16
61.3/ 100
METRIC RATING
172nd/ 347
METRIC RANK
64.6%
IN LABOR FORCE | AGE > 16
4.9/ 100
METRIC RATING
233rd/ 347
METRIC RANK
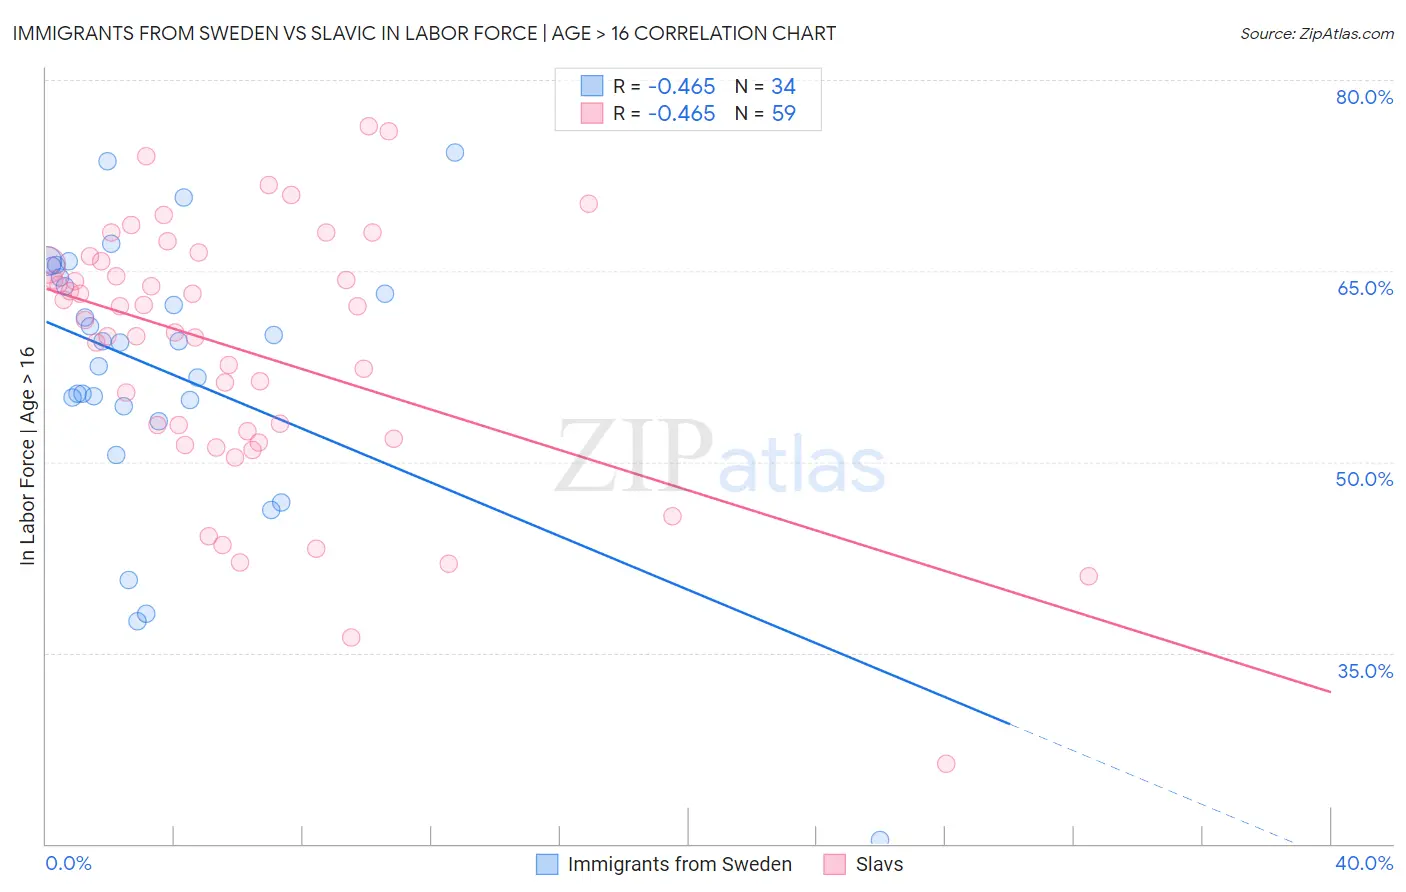
Immigrants from Sweden vs Slavic In Labor Force | Age > 16 Correlation Chart
The statistical analysis conducted on geographies consisting of 164,749,853 people shows a moderate negative correlation between the proportion of Immigrants from Sweden and labor force participation rate among population ages 16 and over in the United States with a correlation coefficient (R) of -0.465 and weighted average of 65.2%. Similarly, the statistical analysis conducted on geographies consisting of 270,879,770 people shows a moderate negative correlation between the proportion of Slavs and labor force participation rate among population ages 16 and over in the United States with a correlation coefficient (R) of -0.465 and weighted average of 64.6%, a difference of 0.97%.
In Labor Force | Age > 16 Correlation Summary
| Measurement | Immigrants from Sweden | Slavic |
| Minimum | 20.3% | 26.3% |
| Maximum | 74.3% | 76.4% |
| Range | 54.0% | 50.1% |
| Mean | 57.1% | 58.7% |
| Median | 59.4% | 61.2% |
| Interquartile 25% (IQ1) | 54.4% | 51.8% |
| Interquartile 75% (IQ3) | 64.5% | 65.8% |
| Interquartile Range (IQR) | 10.1% | 14.0% |
| Standard Deviation (Sample) | 11.1% | 10.3% |
| Standard Deviation (Population) | 10.9% | 10.2% |
Similar Demographics by In Labor Force | Age > 16
Demographics Similar to Immigrants from Sweden by In Labor Force | Age > 16
In terms of in labor force | age > 16, the demographic groups most similar to Immigrants from Sweden are Immigrants from Israel (65.2%, a difference of 0.0%), Israeli (65.2%, a difference of 0.0%), Arab (65.2%, a difference of 0.010%), Serbian (65.2%, a difference of 0.030%), and Immigrants from Belarus (65.2%, a difference of 0.060%).
| Demographics | Rating | Rank | In Labor Force | Age > 16 |
| Immigrants | Kazakhstan | 68.1 /100 | #165 | Good 65.3% |
| Immigrants | Western Asia | 67.3 /100 | #166 | Good 65.3% |
| Immigrants | Belarus | 66.0 /100 | #167 | Good 65.2% |
| Serbians | 63.5 /100 | #168 | Good 65.2% |
| Arabs | 62.4 /100 | #169 | Good 65.2% |
| Immigrants | Israel | 61.7 /100 | #170 | Good 65.2% |
| Israelis | 61.6 /100 | #171 | Good 65.2% |
| Immigrants | Sweden | 61.3 /100 | #172 | Good 65.2% |
| Immigrants | Ukraine | 53.7 /100 | #173 | Average 65.1% |
| Macedonians | 50.0 /100 | #174 | Average 65.1% |
| Nicaraguans | 49.7 /100 | #175 | Average 65.1% |
| Swedes | 47.4 /100 | #176 | Average 65.1% |
| Eastern Europeans | 46.2 /100 | #177 | Average 65.1% |
| Trinidadians and Tobagonians | 45.2 /100 | #178 | Average 65.1% |
| Immigrants | Haiti | 43.3 /100 | #179 | Average 65.1% |
Demographics Similar to Slavs by In Labor Force | Age > 16
In terms of in labor force | age > 16, the demographic groups most similar to Slavs are Vietnamese (64.6%, a difference of 0.010%), Austrian (64.6%, a difference of 0.020%), Immigrants from Norway (64.6%, a difference of 0.020%), Italian (64.6%, a difference of 0.020%), and African (64.6%, a difference of 0.050%).
| Demographics | Rating | Rank | In Labor Force | Age > 16 |
| Europeans | 8.3 /100 | #226 | Tragic 64.7% |
| Poles | 8.3 /100 | #227 | Tragic 64.7% |
| Northern Europeans | 8.2 /100 | #228 | Tragic 64.7% |
| British | 7.3 /100 | #229 | Tragic 64.7% |
| Chinese | 7.3 /100 | #230 | Tragic 64.7% |
| Immigrants | Northern Europe | 7.2 /100 | #231 | Tragic 64.7% |
| Africans | 5.8 /100 | #232 | Tragic 64.6% |
| Slavs | 4.9 /100 | #233 | Tragic 64.6% |
| Vietnamese | 4.7 /100 | #234 | Tragic 64.6% |
| Austrians | 4.6 /100 | #235 | Tragic 64.6% |
| Immigrants | Norway | 4.6 /100 | #236 | Tragic 64.6% |
| Italians | 4.6 /100 | #237 | Tragic 64.6% |
| Lebanese | 3.9 /100 | #238 | Tragic 64.5% |
| Immigrants | Hungary | 3.8 /100 | #239 | Tragic 64.5% |
| Immigrants | Bangladesh | 3.6 /100 | #240 | Tragic 64.5% |