Welsh vs Slavic In Labor Force | Age > 16
COMPARE
Welsh
Slavic
In Labor Force | Age > 16
In Labor Force | Age > 16 Comparison
Welsh
Slavs
64.0%
IN LABOR FORCE | AGE > 16
0.2/ 100
METRIC RATING
279th/ 347
METRIC RANK
64.6%
IN LABOR FORCE | AGE > 16
4.9/ 100
METRIC RATING
233rd/ 347
METRIC RANK
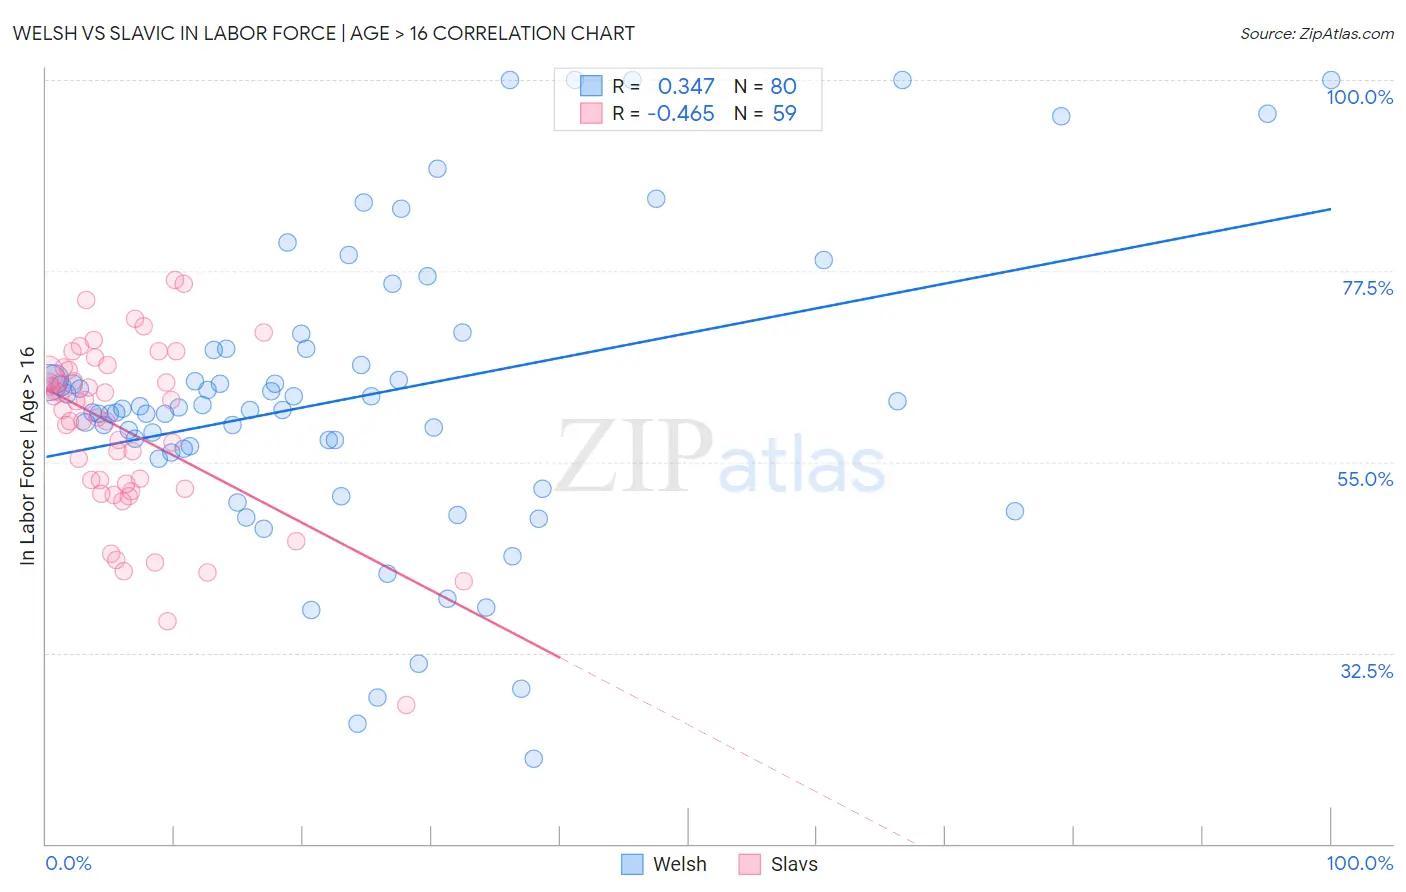
Welsh vs Slavic In Labor Force | Age > 16 Correlation Chart
The statistical analysis conducted on geographies consisting of 528,607,710 people shows a mild positive correlation between the proportion of Welsh and labor force participation rate among population ages 16 and over in the United States with a correlation coefficient (R) of 0.347 and weighted average of 64.0%. Similarly, the statistical analysis conducted on geographies consisting of 270,879,770 people shows a moderate negative correlation between the proportion of Slavs and labor force participation rate among population ages 16 and over in the United States with a correlation coefficient (R) of -0.465 and weighted average of 64.6%, a difference of 0.89%.
In Labor Force | Age > 16 Correlation Summary
| Measurement | Welsh | Slavic |
| Minimum | 20.0% | 26.3% |
| Maximum | 100.0% | 76.4% |
| Range | 80.0% | 50.1% |
| Mean | 62.6% | 58.7% |
| Median | 61.3% | 61.2% |
| Interquartile 25% (IQ1) | 56.3% | 51.8% |
| Interquartile 75% (IQ3) | 68.3% | 65.8% |
| Interquartile Range (IQR) | 12.0% | 14.0% |
| Standard Deviation (Sample) | 17.5% | 10.3% |
| Standard Deviation (Population) | 17.3% | 10.2% |
Similar Demographics by In Labor Force | Age > 16
Demographics Similar to Welsh by In Labor Force | Age > 16
In terms of in labor force | age > 16, the demographic groups most similar to Welsh are Immigrants from St. Vincent and the Grenadines (64.0%, a difference of 0.010%), French Canadian (64.0%, a difference of 0.010%), Assyrian/Chaldean/Syriac (64.0%, a difference of 0.030%), Immigrants from Bahamas (64.0%, a difference of 0.060%), and Immigrants from Cuba (64.1%, a difference of 0.090%).
| Demographics | Rating | Rank | In Labor Force | Age > 16 |
| Native Hawaiians | 0.3 /100 | #272 | Tragic 64.1% |
| Hmong | 0.3 /100 | #273 | Tragic 64.1% |
| Immigrants | Cuba | 0.3 /100 | #274 | Tragic 64.1% |
| Mexicans | 0.3 /100 | #275 | Tragic 64.1% |
| French American Indians | 0.3 /100 | #276 | Tragic 64.1% |
| Immigrants | Bahamas | 0.3 /100 | #277 | Tragic 64.0% |
| Assyrians/Chaldeans/Syriacs | 0.3 /100 | #278 | Tragic 64.0% |
| Welsh | 0.2 /100 | #279 | Tragic 64.0% |
| Immigrants | St. Vincent and the Grenadines | 0.2 /100 | #280 | Tragic 64.0% |
| French Canadians | 0.2 /100 | #281 | Tragic 64.0% |
| Immigrants | Guyana | 0.2 /100 | #282 | Tragic 64.0% |
| Immigrants | Germany | 0.1 /100 | #283 | Tragic 63.9% |
| French | 0.1 /100 | #284 | Tragic 63.9% |
| Slovaks | 0.1 /100 | #285 | Tragic 63.9% |
| Immigrants | Austria | 0.1 /100 | #286 | Tragic 63.9% |
Demographics Similar to Slavs by In Labor Force | Age > 16
In terms of in labor force | age > 16, the demographic groups most similar to Slavs are Vietnamese (64.6%, a difference of 0.010%), Austrian (64.6%, a difference of 0.020%), Immigrants from Norway (64.6%, a difference of 0.020%), Italian (64.6%, a difference of 0.020%), and African (64.6%, a difference of 0.050%).
| Demographics | Rating | Rank | In Labor Force | Age > 16 |
| Europeans | 8.3 /100 | #226 | Tragic 64.7% |
| Poles | 8.3 /100 | #227 | Tragic 64.7% |
| Northern Europeans | 8.2 /100 | #228 | Tragic 64.7% |
| British | 7.3 /100 | #229 | Tragic 64.7% |
| Chinese | 7.3 /100 | #230 | Tragic 64.7% |
| Immigrants | Northern Europe | 7.2 /100 | #231 | Tragic 64.7% |
| Africans | 5.8 /100 | #232 | Tragic 64.6% |
| Slavs | 4.9 /100 | #233 | Tragic 64.6% |
| Vietnamese | 4.7 /100 | #234 | Tragic 64.6% |
| Austrians | 4.6 /100 | #235 | Tragic 64.6% |
| Immigrants | Norway | 4.6 /100 | #236 | Tragic 64.6% |
| Italians | 4.6 /100 | #237 | Tragic 64.6% |
| Lebanese | 3.9 /100 | #238 | Tragic 64.5% |
| Immigrants | Hungary | 3.8 /100 | #239 | Tragic 64.5% |
| Immigrants | Bangladesh | 3.6 /100 | #240 | Tragic 64.5% |