German vs Slavic In Labor Force | Age 30-34
COMPARE
German
Slavic
In Labor Force | Age 30-34
In Labor Force | Age 30-34 Comparison
Germans
Slavs
84.8%
IN LABOR FORCE | AGE 30-34
75.1/ 100
METRIC RATING
150th/ 347
METRIC RANK
85.0%
IN LABOR FORCE | AGE 30-34
90.7/ 100
METRIC RATING
127th/ 347
METRIC RANK
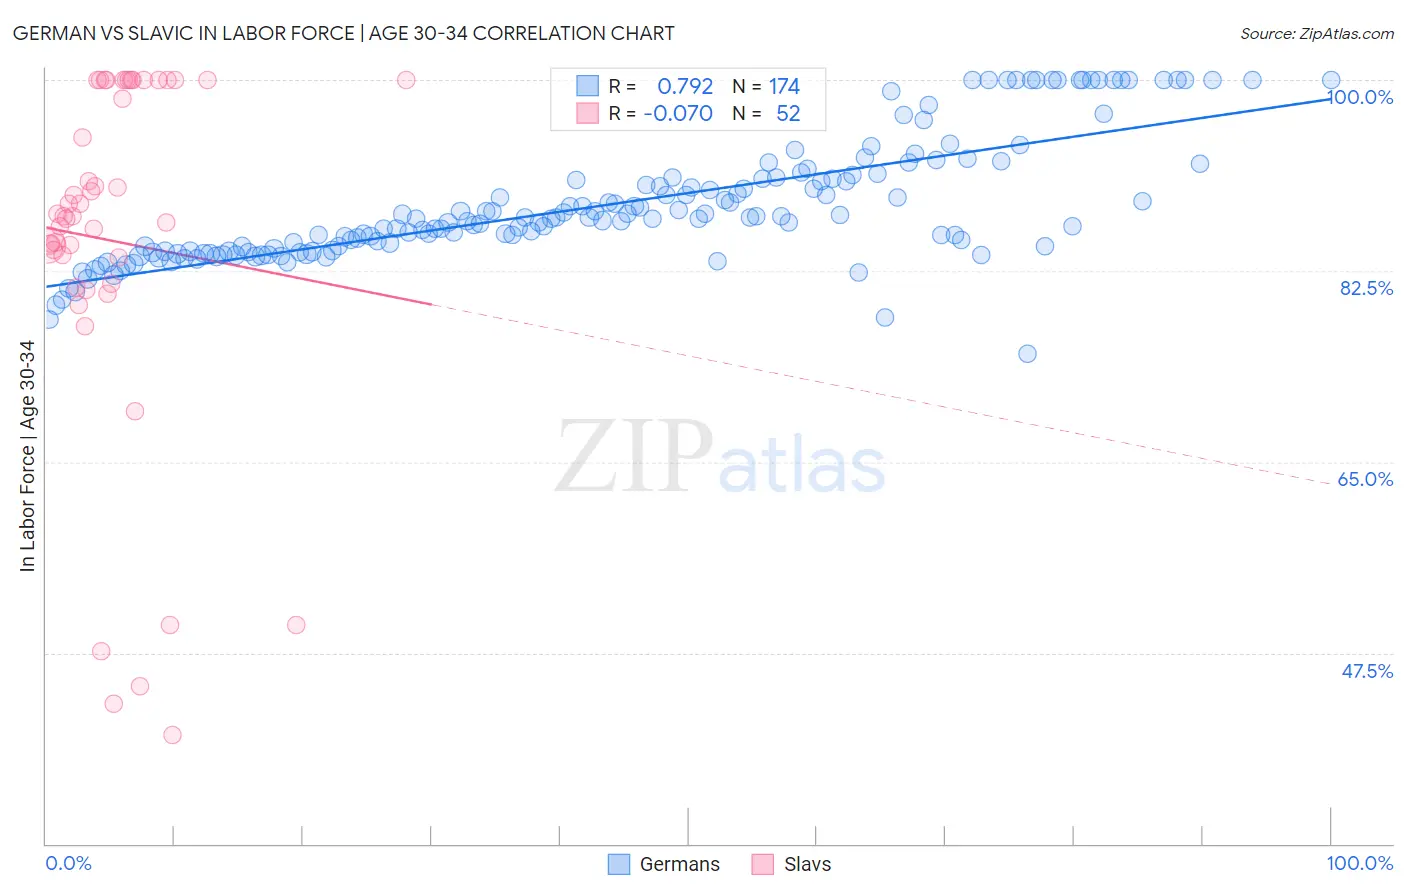
German vs Slavic In Labor Force | Age 30-34 Correlation Chart
The statistical analysis conducted on geographies consisting of 579,117,313 people shows a strong positive correlation between the proportion of Germans and labor force participation rate among population between the ages 30 and 34 in the United States with a correlation coefficient (R) of 0.792 and weighted average of 84.8%. Similarly, the statistical analysis conducted on geographies consisting of 270,763,521 people shows a slight negative correlation between the proportion of Slavs and labor force participation rate among population between the ages 30 and 34 in the United States with a correlation coefficient (R) of -0.070 and weighted average of 85.0%, a difference of 0.21%.
In Labor Force | Age 30-34 Correlation Summary
| Measurement | German | Slavic |
| Minimum | 75.0% | 40.0% |
| Maximum | 100.0% | 100.0% |
| Range | 25.0% | 60.0% |
| Mean | 88.6% | 85.2% |
| Median | 87.3% | 87.5% |
| Interquartile 25% (IQ1) | 84.4% | 82.5% |
| Interquartile 75% (IQ3) | 91.0% | 100.0% |
| Interquartile Range (IQR) | 6.7% | 17.5% |
| Standard Deviation (Sample) | 5.6% | 16.3% |
| Standard Deviation (Population) | 5.6% | 16.1% |
Similar Demographics by In Labor Force | Age 30-34
Demographics Similar to Germans by In Labor Force | Age 30-34
In terms of in labor force | age 30-34, the demographic groups most similar to Germans are Immigrants from Ukraine (84.8%, a difference of 0.0%), Immigrants from Saudi Arabia (84.9%, a difference of 0.010%), Immigrants from Colombia (84.9%, a difference of 0.010%), Immigrants from Pakistan (84.9%, a difference of 0.010%), and Immigrants from Senegal (84.8%, a difference of 0.010%).
| Demographics | Rating | Rank | In Labor Force | Age 30-34 |
| Colombians | 82.2 /100 | #143 | Excellent 84.9% |
| Uruguayans | 78.5 /100 | #144 | Good 84.9% |
| Palestinians | 77.7 /100 | #145 | Good 84.9% |
| Immigrants | Saudi Arabia | 76.6 /100 | #146 | Good 84.9% |
| Immigrants | Colombia | 76.3 /100 | #147 | Good 84.9% |
| Immigrants | Pakistan | 76.2 /100 | #148 | Good 84.9% |
| Immigrants | Ukraine | 75.1 /100 | #149 | Good 84.8% |
| Germans | 75.1 /100 | #150 | Good 84.8% |
| Immigrants | Senegal | 74.0 /100 | #151 | Good 84.8% |
| Romanians | 73.5 /100 | #152 | Good 84.8% |
| Syrians | 70.1 /100 | #153 | Good 84.8% |
| Northern Europeans | 70.0 /100 | #154 | Good 84.8% |
| Immigrants | Sudan | 69.5 /100 | #155 | Good 84.8% |
| French Canadians | 67.3 /100 | #156 | Good 84.8% |
| Peruvians | 65.9 /100 | #157 | Good 84.8% |
Demographics Similar to Slavs by In Labor Force | Age 30-34
In terms of in labor force | age 30-34, the demographic groups most similar to Slavs are Austrian (85.0%, a difference of 0.0%), Immigrants from Argentina (85.0%, a difference of 0.0%), Immigrants from Western Africa (85.0%, a difference of 0.010%), Immigrants from Spain (85.0%, a difference of 0.010%), and Immigrants from Jordan (85.0%, a difference of 0.020%).
| Demographics | Rating | Rank | In Labor Force | Age 30-34 |
| Immigrants | Southern Europe | 93.3 /100 | #120 | Exceptional 85.1% |
| Immigrants | Egypt | 93.2 /100 | #121 | Exceptional 85.1% |
| Immigrants | Kuwait | 92.6 /100 | #122 | Exceptional 85.1% |
| Armenians | 92.2 /100 | #123 | Exceptional 85.0% |
| Australians | 92.0 /100 | #124 | Exceptional 85.0% |
| Immigrants | Jordan | 91.5 /100 | #125 | Exceptional 85.0% |
| Austrians | 90.9 /100 | #126 | Exceptional 85.0% |
| Slavs | 90.7 /100 | #127 | Exceptional 85.0% |
| Immigrants | Argentina | 90.6 /100 | #128 | Exceptional 85.0% |
| Immigrants | Western Africa | 90.2 /100 | #129 | Exceptional 85.0% |
| Immigrants | Spain | 90.0 /100 | #130 | Exceptional 85.0% |
| Chinese | 89.6 /100 | #131 | Excellent 85.0% |
| Immigrants | Israel | 89.5 /100 | #132 | Excellent 85.0% |
| New Zealanders | 89.5 /100 | #133 | Excellent 85.0% |
| Immigrants | Chile | 89.2 /100 | #134 | Excellent 85.0% |