German vs Native Hawaiian In Labor Force | Age 30-34
COMPARE
German
Native Hawaiian
In Labor Force | Age 30-34
In Labor Force | Age 30-34 Comparison
Germans
Native Hawaiians
84.8%
IN LABOR FORCE | AGE 30-34
75.1/ 100
METRIC RATING
150th/ 347
METRIC RANK
83.0%
IN LABOR FORCE | AGE 30-34
0.0/ 100
METRIC RATING
287th/ 347
METRIC RANK
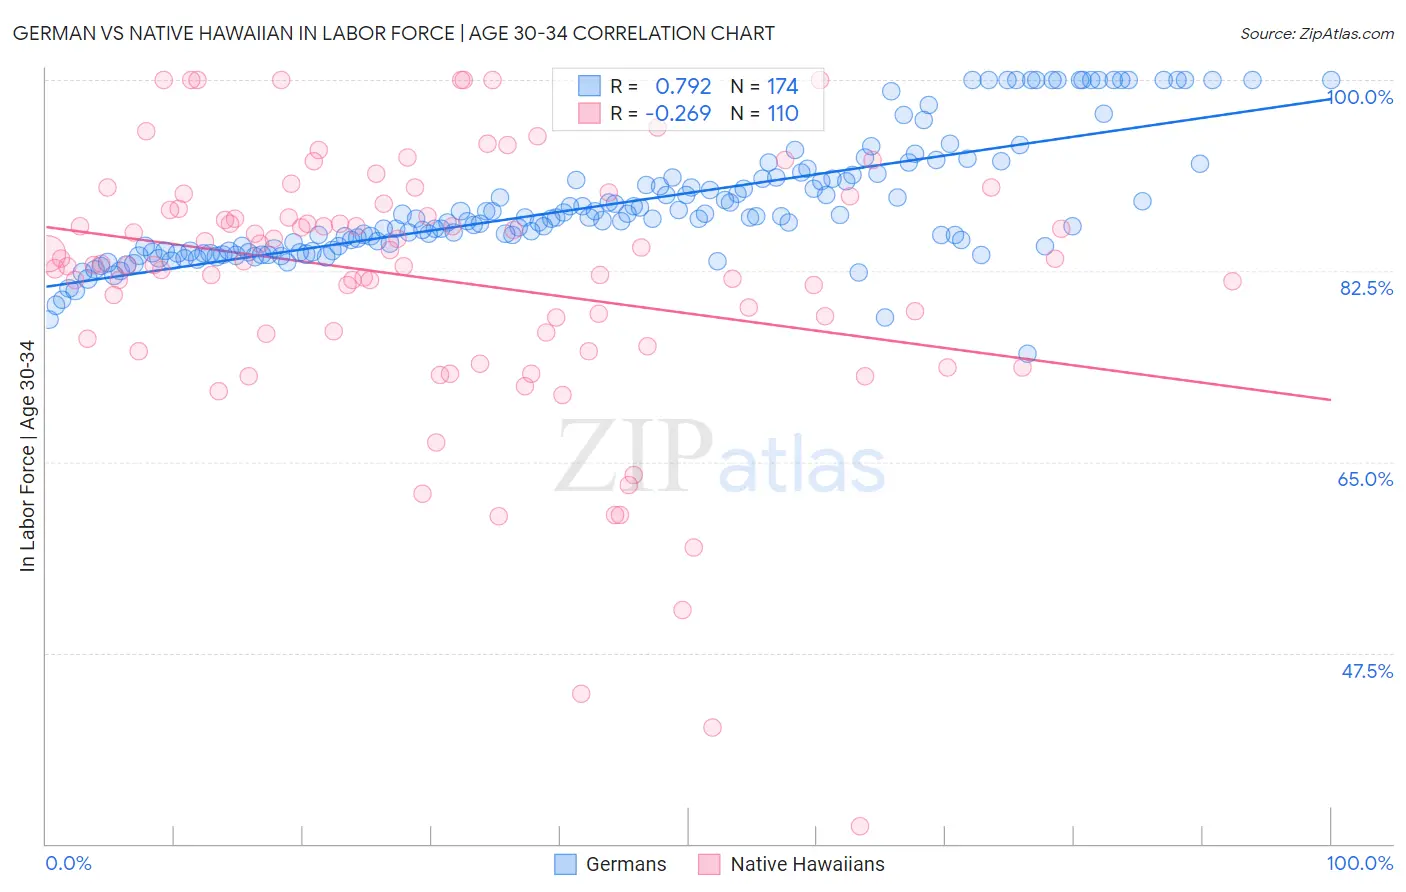
German vs Native Hawaiian In Labor Force | Age 30-34 Correlation Chart
The statistical analysis conducted on geographies consisting of 579,117,313 people shows a strong positive correlation between the proportion of Germans and labor force participation rate among population between the ages 30 and 34 in the United States with a correlation coefficient (R) of 0.792 and weighted average of 84.8%. Similarly, the statistical analysis conducted on geographies consisting of 331,941,727 people shows a weak negative correlation between the proportion of Native Hawaiians and labor force participation rate among population between the ages 30 and 34 in the United States with a correlation coefficient (R) of -0.269 and weighted average of 83.0%, a difference of 2.2%.
In Labor Force | Age 30-34 Correlation Summary
| Measurement | German | Native Hawaiian |
| Minimum | 75.0% | 31.6% |
| Maximum | 100.0% | 100.0% |
| Range | 25.0% | 68.4% |
| Mean | 88.6% | 81.7% |
| Median | 87.3% | 83.3% |
| Interquartile 25% (IQ1) | 84.4% | 76.7% |
| Interquartile 75% (IQ3) | 91.0% | 88.2% |
| Interquartile Range (IQR) | 6.7% | 11.5% |
| Standard Deviation (Sample) | 5.6% | 12.3% |
| Standard Deviation (Population) | 5.6% | 12.2% |
Similar Demographics by In Labor Force | Age 30-34
Demographics Similar to Germans by In Labor Force | Age 30-34
In terms of in labor force | age 30-34, the demographic groups most similar to Germans are Immigrants from Ukraine (84.8%, a difference of 0.0%), Immigrants from Saudi Arabia (84.9%, a difference of 0.010%), Immigrants from Colombia (84.9%, a difference of 0.010%), Immigrants from Pakistan (84.9%, a difference of 0.010%), and Immigrants from Senegal (84.8%, a difference of 0.010%).
| Demographics | Rating | Rank | In Labor Force | Age 30-34 |
| Colombians | 82.2 /100 | #143 | Excellent 84.9% |
| Uruguayans | 78.5 /100 | #144 | Good 84.9% |
| Palestinians | 77.7 /100 | #145 | Good 84.9% |
| Immigrants | Saudi Arabia | 76.6 /100 | #146 | Good 84.9% |
| Immigrants | Colombia | 76.3 /100 | #147 | Good 84.9% |
| Immigrants | Pakistan | 76.2 /100 | #148 | Good 84.9% |
| Immigrants | Ukraine | 75.1 /100 | #149 | Good 84.8% |
| Germans | 75.1 /100 | #150 | Good 84.8% |
| Immigrants | Senegal | 74.0 /100 | #151 | Good 84.8% |
| Romanians | 73.5 /100 | #152 | Good 84.8% |
| Syrians | 70.1 /100 | #153 | Good 84.8% |
| Northern Europeans | 70.0 /100 | #154 | Good 84.8% |
| Immigrants | Sudan | 69.5 /100 | #155 | Good 84.8% |
| French Canadians | 67.3 /100 | #156 | Good 84.8% |
| Peruvians | 65.9 /100 | #157 | Good 84.8% |
Demographics Similar to Native Hawaiians by In Labor Force | Age 30-34
In terms of in labor force | age 30-34, the demographic groups most similar to Native Hawaiians are Central American Indian (83.0%, a difference of 0.030%), Hawaiian (83.0%, a difference of 0.050%), Immigrants from Latin America (83.1%, a difference of 0.10%), Immigrants from Belize (83.2%, a difference of 0.16%), and Cree (83.2%, a difference of 0.16%).
| Demographics | Rating | Rank | In Labor Force | Age 30-34 |
| Africans | 0.0 /100 | #280 | Tragic 83.4% |
| Samoans | 0.0 /100 | #281 | Tragic 83.3% |
| Mexican American Indians | 0.0 /100 | #282 | Tragic 83.2% |
| Assyrians/Chaldeans/Syriacs | 0.0 /100 | #283 | Tragic 83.2% |
| Immigrants | Belize | 0.0 /100 | #284 | Tragic 83.2% |
| Cree | 0.0 /100 | #285 | Tragic 83.2% |
| Immigrants | Latin America | 0.0 /100 | #286 | Tragic 83.1% |
| Native Hawaiians | 0.0 /100 | #287 | Tragic 83.0% |
| Central American Indians | 0.0 /100 | #288 | Tragic 83.0% |
| Hawaiians | 0.0 /100 | #289 | Tragic 83.0% |
| Blackfeet | 0.0 /100 | #290 | Tragic 82.8% |
| Potawatomi | 0.0 /100 | #291 | Tragic 82.8% |
| Blacks/African Americans | 0.0 /100 | #292 | Tragic 82.8% |
| Nepalese | 0.0 /100 | #293 | Tragic 82.7% |
| Americans | 0.0 /100 | #294 | Tragic 82.7% |