German vs Slavic 12th Grade, No Diploma
COMPARE
German
Slavic
12th Grade, No Diploma
12th Grade, No Diploma Comparison
Germans
Slavs
93.3%
12TH GRADE, NO DIPLOMA
99.9/ 100
METRIC RATING
19th/ 347
METRIC RANK
92.8%
12TH GRADE, NO DIPLOMA
99.7/ 100
METRIC RATING
60th/ 347
METRIC RANK
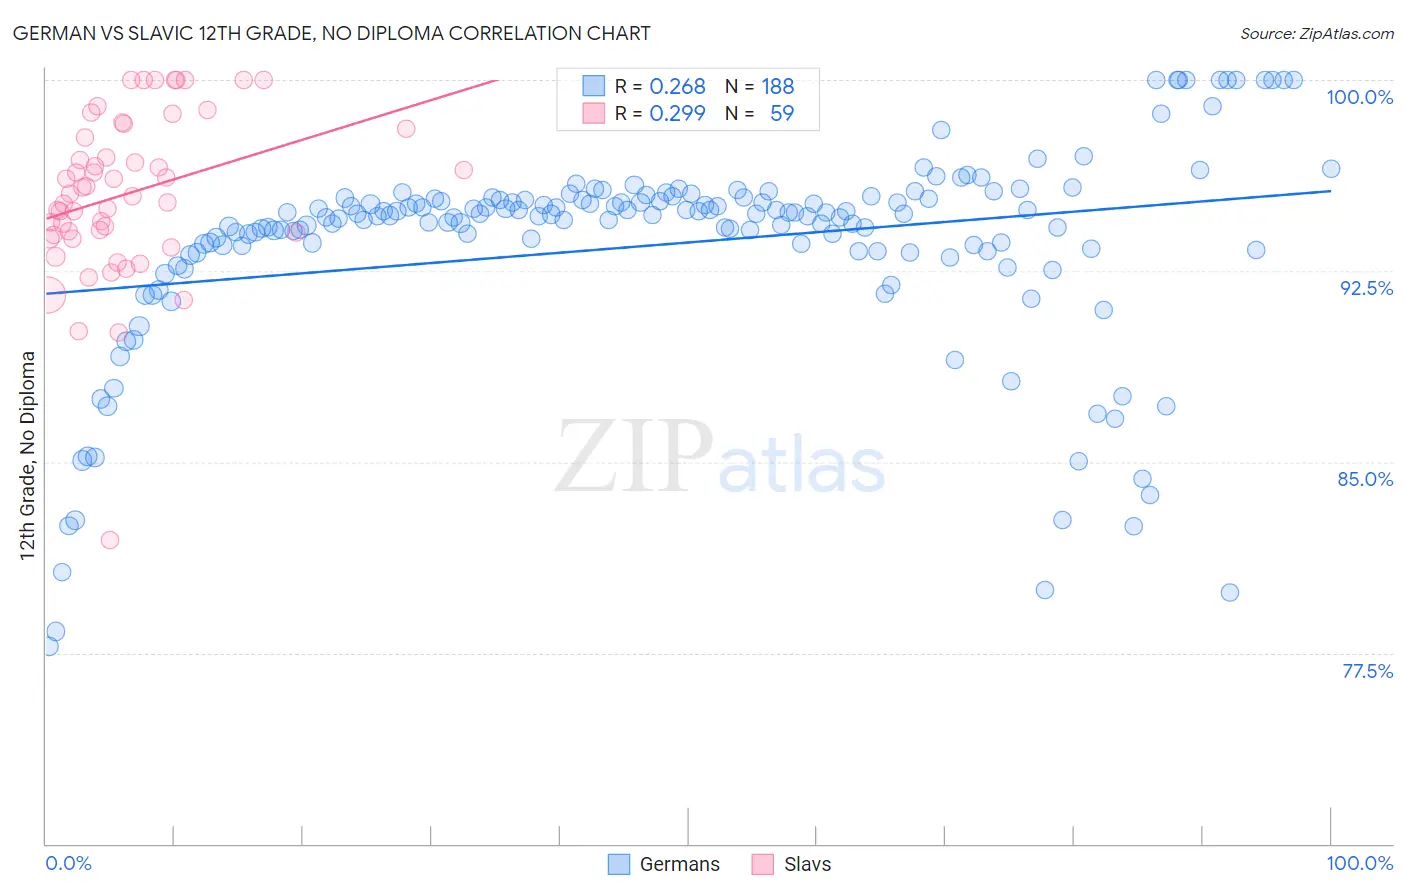
German vs Slavic 12th Grade, No Diploma Correlation Chart
The statistical analysis conducted on geographies consisting of 581,301,284 people shows a weak positive correlation between the proportion of Germans and percentage of population with at least 12th grade (no diploma) education in the United States with a correlation coefficient (R) of 0.268 and weighted average of 93.3%. Similarly, the statistical analysis conducted on geographies consisting of 270,868,354 people shows a weak positive correlation between the proportion of Slavs and percentage of population with at least 12th grade (no diploma) education in the United States with a correlation coefficient (R) of 0.299 and weighted average of 92.8%, a difference of 0.52%.
12th Grade, No Diploma Correlation Summary
| Measurement | German | Slavic |
| Minimum | 77.8% | 81.9% |
| Maximum | 100.0% | 100.0% |
| Range | 22.2% | 18.1% |
| Mean | 93.5% | 95.5% |
| Median | 94.7% | 95.5% |
| Interquartile 25% (IQ1) | 93.3% | 93.9% |
| Interquartile 75% (IQ3) | 95.3% | 98.1% |
| Interquartile Range (IQR) | 2.0% | 4.2% |
| Standard Deviation (Sample) | 4.1% | 3.2% |
| Standard Deviation (Population) | 4.1% | 3.2% |
Similar Demographics by 12th Grade, No Diploma
Demographics Similar to Germans by 12th Grade, No Diploma
In terms of 12th grade, no diploma, the demographic groups most similar to Germans are Immigrants from Singapore (93.3%, a difference of 0.020%), Filipino (93.2%, a difference of 0.030%), Luxembourger (93.3%, a difference of 0.050%), Italian (93.2%, a difference of 0.050%), and Estonian (93.2%, a difference of 0.060%).
| Demographics | Rating | Rank | 12th Grade, No Diploma |
| Eastern Europeans | 100.0 /100 | #12 | Exceptional 93.5% |
| Danes | 100.0 /100 | #13 | Exceptional 93.5% |
| Bulgarians | 100.0 /100 | #14 | Exceptional 93.5% |
| Finns | 100.0 /100 | #15 | Exceptional 93.4% |
| Maltese | 100.0 /100 | #16 | Exceptional 93.3% |
| Luxembourgers | 100.0 /100 | #17 | Exceptional 93.3% |
| Immigrants | Singapore | 99.9 /100 | #18 | Exceptional 93.3% |
| Germans | 99.9 /100 | #19 | Exceptional 93.3% |
| Filipinos | 99.9 /100 | #20 | Exceptional 93.2% |
| Italians | 99.9 /100 | #21 | Exceptional 93.2% |
| Estonians | 99.9 /100 | #22 | Exceptional 93.2% |
| Scandinavians | 99.9 /100 | #23 | Exceptional 93.2% |
| Thais | 99.9 /100 | #24 | Exceptional 93.2% |
| Czechs | 99.9 /100 | #25 | Exceptional 93.2% |
| Russians | 99.9 /100 | #26 | Exceptional 93.2% |
Demographics Similar to Slavs by 12th Grade, No Diploma
In terms of 12th grade, no diploma, the demographic groups most similar to Slavs are Immigrants from North America (92.8%, a difference of 0.0%), Immigrants from Taiwan (92.8%, a difference of 0.010%), Immigrants from Japan (92.8%, a difference of 0.020%), Immigrants from Canada (92.8%, a difference of 0.030%), and Ukrainian (92.7%, a difference of 0.040%).
| Demographics | Rating | Rank | 12th Grade, No Diploma |
| Serbians | 99.7 /100 | #53 | Exceptional 92.8% |
| Hungarians | 99.7 /100 | #54 | Exceptional 92.8% |
| Welsh | 99.7 /100 | #55 | Exceptional 92.8% |
| New Zealanders | 99.7 /100 | #56 | Exceptional 92.8% |
| Immigrants | Canada | 99.7 /100 | #57 | Exceptional 92.8% |
| Immigrants | Taiwan | 99.7 /100 | #58 | Exceptional 92.8% |
| Immigrants | North America | 99.7 /100 | #59 | Exceptional 92.8% |
| Slavs | 99.7 /100 | #60 | Exceptional 92.8% |
| Immigrants | Japan | 99.7 /100 | #61 | Exceptional 92.8% |
| Ukrainians | 99.6 /100 | #62 | Exceptional 92.7% |
| Zimbabweans | 99.6 /100 | #63 | Exceptional 92.7% |
| Immigrants | Netherlands | 99.6 /100 | #64 | Exceptional 92.7% |
| Austrians | 99.6 /100 | #65 | Exceptional 92.7% |
| Soviet Union | 99.6 /100 | #66 | Exceptional 92.7% |
| Immigrants | South Africa | 99.5 /100 | #67 | Exceptional 92.7% |