Trinidadian and Tobagonian vs Slavic In Labor Force | Age 30-34
COMPARE
Trinidadian and Tobagonian
Slavic
In Labor Force | Age 30-34
In Labor Force | Age 30-34 Comparison
Trinidadians and Tobagonians
Slavs
84.5%
IN LABOR FORCE | AGE 30-34
18.2/ 100
METRIC RATING
201st/ 347
METRIC RANK
85.0%
IN LABOR FORCE | AGE 30-34
90.7/ 100
METRIC RATING
127th/ 347
METRIC RANK
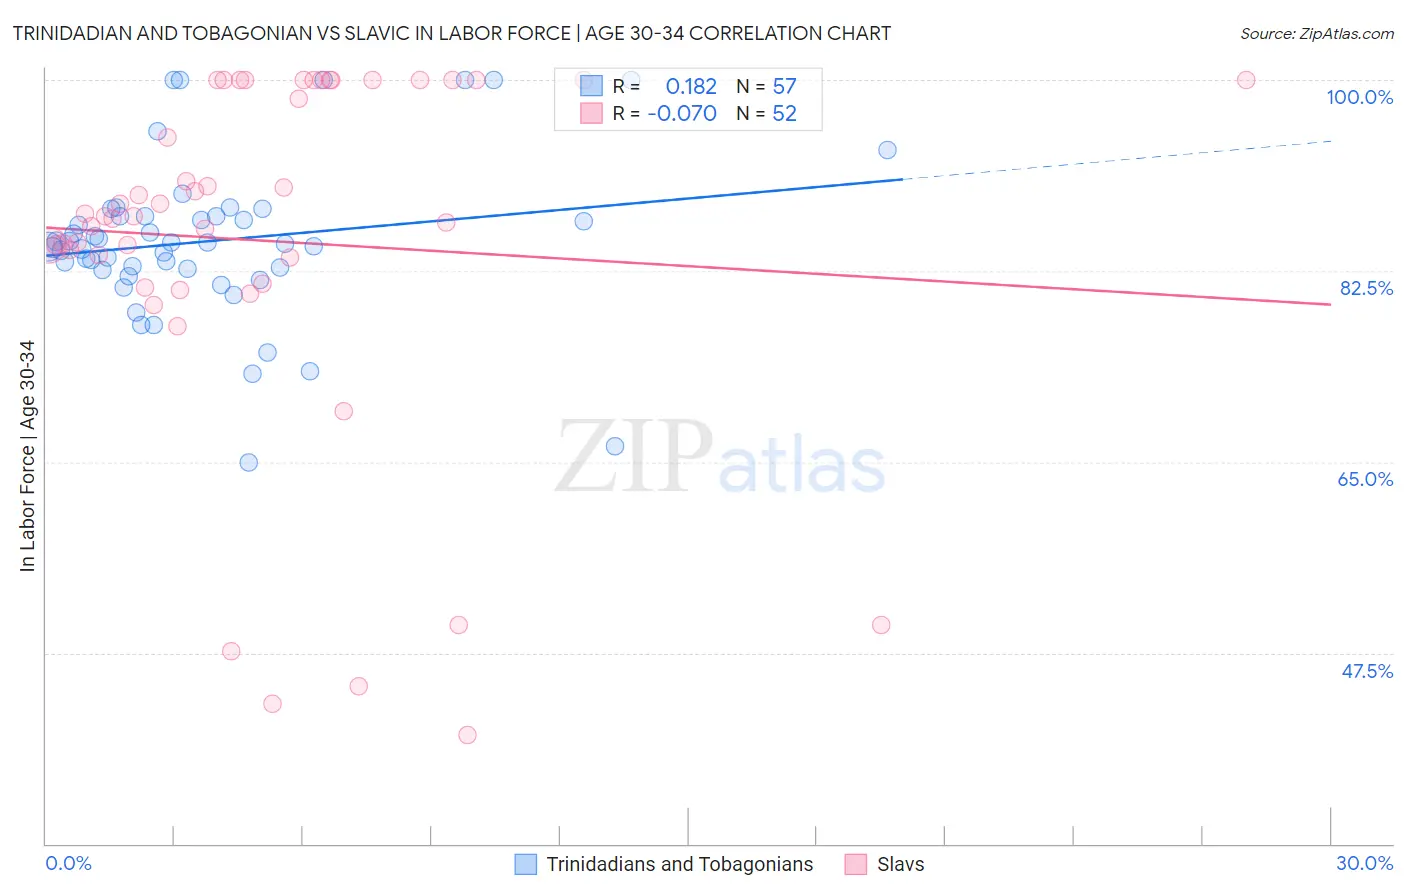
Trinidadian and Tobagonian vs Slavic In Labor Force | Age 30-34 Correlation Chart
The statistical analysis conducted on geographies consisting of 219,758,716 people shows a poor positive correlation between the proportion of Trinidadians and Tobagonians and labor force participation rate among population between the ages 30 and 34 in the United States with a correlation coefficient (R) of 0.182 and weighted average of 84.5%. Similarly, the statistical analysis conducted on geographies consisting of 270,763,521 people shows a slight negative correlation between the proportion of Slavs and labor force participation rate among population between the ages 30 and 34 in the United States with a correlation coefficient (R) of -0.070 and weighted average of 85.0%, a difference of 0.67%.
In Labor Force | Age 30-34 Correlation Summary
| Measurement | Trinidadian and Tobagonian | Slavic |
| Minimum | 65.0% | 40.0% |
| Maximum | 100.0% | 100.0% |
| Range | 35.0% | 60.0% |
| Mean | 85.3% | 85.2% |
| Median | 84.9% | 87.5% |
| Interquartile 25% (IQ1) | 82.6% | 82.5% |
| Interquartile 75% (IQ3) | 87.5% | 100.0% |
| Interquartile Range (IQR) | 4.9% | 17.5% |
| Standard Deviation (Sample) | 7.3% | 16.3% |
| Standard Deviation (Population) | 7.3% | 16.1% |
Similar Demographics by In Labor Force | Age 30-34
Demographics Similar to Trinidadians and Tobagonians by In Labor Force | Age 30-34
In terms of in labor force | age 30-34, the demographic groups most similar to Trinidadians and Tobagonians are Immigrants from West Indies (84.5%, a difference of 0.0%), Immigrants from Thailand (84.5%, a difference of 0.010%), Subsaharan African (84.5%, a difference of 0.010%), Dutch (84.5%, a difference of 0.020%), and Canadian (84.4%, a difference of 0.030%).
| Demographics | Rating | Rank | In Labor Force | Age 30-34 |
| Immigrants | Afghanistan | 23.5 /100 | #194 | Fair 84.5% |
| Koreans | 23.2 /100 | #195 | Fair 84.5% |
| British | 22.9 /100 | #196 | Fair 84.5% |
| Immigrants | Syria | 21.9 /100 | #197 | Fair 84.5% |
| Dutch | 20.2 /100 | #198 | Fair 84.5% |
| Immigrants | Thailand | 19.1 /100 | #199 | Poor 84.5% |
| Sub-Saharan Africans | 19.0 /100 | #200 | Poor 84.5% |
| Trinidadians and Tobagonians | 18.2 /100 | #201 | Poor 84.5% |
| Immigrants | West Indies | 18.1 /100 | #202 | Poor 84.5% |
| Canadians | 15.4 /100 | #203 | Poor 84.4% |
| Ecuadorians | 14.2 /100 | #204 | Poor 84.4% |
| French | 13.8 /100 | #205 | Poor 84.4% |
| Lebanese | 10.6 /100 | #206 | Poor 84.4% |
| Bangladeshis | 9.4 /100 | #207 | Tragic 84.3% |
| Arabs | 8.9 /100 | #208 | Tragic 84.3% |
Demographics Similar to Slavs by In Labor Force | Age 30-34
In terms of in labor force | age 30-34, the demographic groups most similar to Slavs are Austrian (85.0%, a difference of 0.0%), Immigrants from Argentina (85.0%, a difference of 0.0%), Immigrants from Western Africa (85.0%, a difference of 0.010%), Immigrants from Spain (85.0%, a difference of 0.010%), and Immigrants from Jordan (85.0%, a difference of 0.020%).
| Demographics | Rating | Rank | In Labor Force | Age 30-34 |
| Immigrants | Southern Europe | 93.3 /100 | #120 | Exceptional 85.1% |
| Immigrants | Egypt | 93.2 /100 | #121 | Exceptional 85.1% |
| Immigrants | Kuwait | 92.6 /100 | #122 | Exceptional 85.1% |
| Armenians | 92.2 /100 | #123 | Exceptional 85.0% |
| Australians | 92.0 /100 | #124 | Exceptional 85.0% |
| Immigrants | Jordan | 91.5 /100 | #125 | Exceptional 85.0% |
| Austrians | 90.9 /100 | #126 | Exceptional 85.0% |
| Slavs | 90.7 /100 | #127 | Exceptional 85.0% |
| Immigrants | Argentina | 90.6 /100 | #128 | Exceptional 85.0% |
| Immigrants | Western Africa | 90.2 /100 | #129 | Exceptional 85.0% |
| Immigrants | Spain | 90.0 /100 | #130 | Exceptional 85.0% |
| Chinese | 89.6 /100 | #131 | Excellent 85.0% |
| Immigrants | Israel | 89.5 /100 | #132 | Excellent 85.0% |
| New Zealanders | 89.5 /100 | #133 | Excellent 85.0% |
| Immigrants | Chile | 89.2 /100 | #134 | Excellent 85.0% |