Filipino vs Immigrants from Italy In Labor Force | Age > 16
COMPARE
Filipino
Immigrants from Italy
In Labor Force | Age > 16
In Labor Force | Age > 16 Comparison
Filipinos
Immigrants from Italy
65.9%
IN LABOR FORCE | AGE > 16
98.9/ 100
METRIC RATING
97th/ 347
METRIC RANK
65.0%
IN LABOR FORCE | AGE > 16
28.7/ 100
METRIC RATING
197th/ 347
METRIC RANK
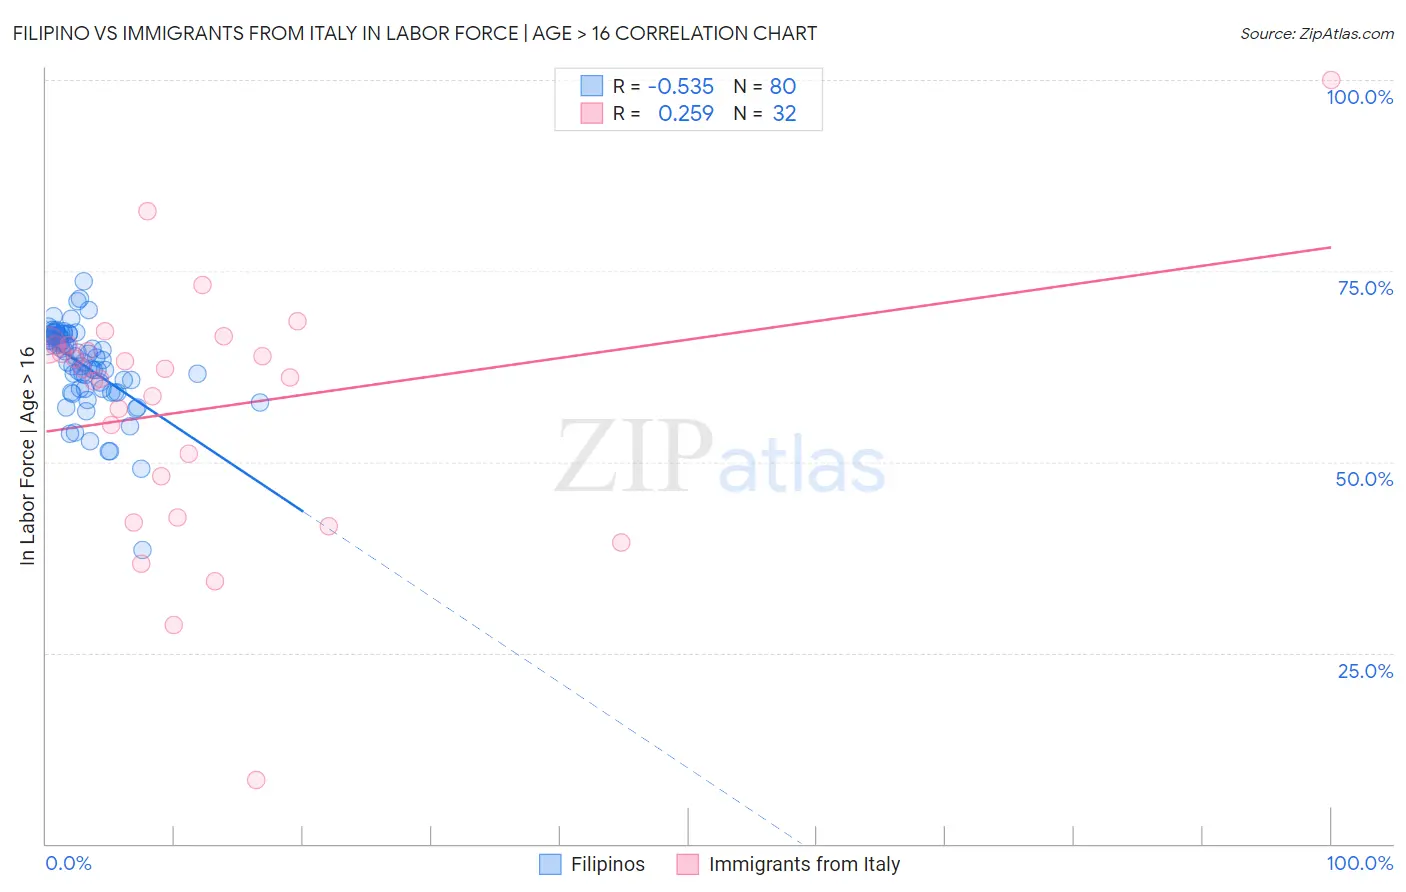
Filipino vs Immigrants from Italy In Labor Force | Age > 16 Correlation Chart
The statistical analysis conducted on geographies consisting of 254,350,604 people shows a substantial negative correlation between the proportion of Filipinos and labor force participation rate among population ages 16 and over in the United States with a correlation coefficient (R) of -0.535 and weighted average of 65.9%. Similarly, the statistical analysis conducted on geographies consisting of 324,219,565 people shows a weak positive correlation between the proportion of Immigrants from Italy and labor force participation rate among population ages 16 and over in the United States with a correlation coefficient (R) of 0.259 and weighted average of 65.0%, a difference of 1.5%.
In Labor Force | Age > 16 Correlation Summary
| Measurement | Filipino | Immigrants from Italy |
| Minimum | 38.4% | 8.3% |
| Maximum | 73.7% | 100.0% |
| Range | 35.3% | 91.7% |
| Mean | 62.6% | 57.0% |
| Median | 63.7% | 61.6% |
| Interquartile 25% (IQ1) | 59.6% | 45.4% |
| Interquartile 75% (IQ3) | 66.6% | 65.3% |
| Interquartile Range (IQR) | 7.0% | 19.8% |
| Standard Deviation (Sample) | 5.6% | 16.9% |
| Standard Deviation (Population) | 5.5% | 16.6% |
Similar Demographics by In Labor Force | Age > 16
Demographics Similar to Filipinos by In Labor Force | Age > 16
In terms of in labor force | age > 16, the demographic groups most similar to Filipinos are Bangladeshi (65.9%, a difference of 0.010%), Immigrants from Chile (65.9%, a difference of 0.030%), Immigrants from Cambodia (66.0%, a difference of 0.050%), Immigrants from Uruguay (66.0%, a difference of 0.050%), and Immigrants from Australia (65.9%, a difference of 0.050%).
| Demographics | Rating | Rank | In Labor Force | Age > 16 |
| Chileans | 99.2 /100 | #90 | Exceptional 66.0% |
| Iranians | 99.2 /100 | #91 | Exceptional 66.0% |
| Aleuts | 99.1 /100 | #92 | Exceptional 66.0% |
| Immigrants | South America | 99.1 /100 | #93 | Exceptional 66.0% |
| Immigrants | Cambodia | 99.1 /100 | #94 | Exceptional 66.0% |
| Immigrants | Uruguay | 99.1 /100 | #95 | Exceptional 66.0% |
| Bangladeshis | 98.9 /100 | #96 | Exceptional 65.9% |
| Filipinos | 98.9 /100 | #97 | Exceptional 65.9% |
| Immigrants | Chile | 98.7 /100 | #98 | Exceptional 65.9% |
| Immigrants | Australia | 98.7 /100 | #99 | Exceptional 65.9% |
| Okinawans | 98.7 /100 | #100 | Exceptional 65.9% |
| Immigrants | Colombia | 98.6 /100 | #101 | Exceptional 65.9% |
| Uruguayans | 98.6 /100 | #102 | Exceptional 65.9% |
| Immigrants | South Eastern Asia | 98.5 /100 | #103 | Exceptional 65.9% |
| Palestinians | 98.5 /100 | #104 | Exceptional 65.9% |
Demographics Similar to Immigrants from Italy by In Labor Force | Age > 16
In terms of in labor force | age > 16, the demographic groups most similar to Immigrants from Italy are Romanian (65.0%, a difference of 0.030%), Haitian (65.0%, a difference of 0.030%), Immigrants from Southern Europe (65.0%, a difference of 0.040%), Greek (64.9%, a difference of 0.040%), and Immigrants from Europe (65.0%, a difference of 0.060%).
| Demographics | Rating | Rank | In Labor Force | Age > 16 |
| Barbadians | 33.9 /100 | #190 | Fair 65.0% |
| Scandinavians | 33.7 /100 | #191 | Fair 65.0% |
| Immigrants | Fiji | 33.7 /100 | #192 | Fair 65.0% |
| Immigrants | Europe | 33.6 /100 | #193 | Fair 65.0% |
| Immigrants | Southern Europe | 31.3 /100 | #194 | Fair 65.0% |
| Romanians | 31.1 /100 | #195 | Fair 65.0% |
| Haitians | 30.6 /100 | #196 | Fair 65.0% |
| Immigrants | Italy | 28.7 /100 | #197 | Fair 65.0% |
| Greeks | 26.1 /100 | #198 | Fair 64.9% |
| Mexican American Indians | 23.1 /100 | #199 | Fair 64.9% |
| Armenians | 20.2 /100 | #200 | Fair 64.9% |
| Ukrainians | 19.6 /100 | #201 | Poor 64.9% |
| Immigrants | Belgium | 19.4 /100 | #202 | Poor 64.9% |
| Russians | 18.8 /100 | #203 | Poor 64.9% |
| Slovenes | 18.7 /100 | #204 | Poor 64.9% |