Filipino vs Immigrants from Cabo Verde In Labor Force | Age > 16
COMPARE
Filipino
Immigrants from Cabo Verde
In Labor Force | Age > 16
In Labor Force | Age > 16 Comparison
Filipinos
Immigrants from Cabo Verde
65.9%
IN LABOR FORCE | AGE > 16
98.9/ 100
METRIC RATING
97th/ 347
METRIC RANK
67.3%
IN LABOR FORCE | AGE > 16
100.0/ 100
METRIC RATING
26th/ 347
METRIC RANK
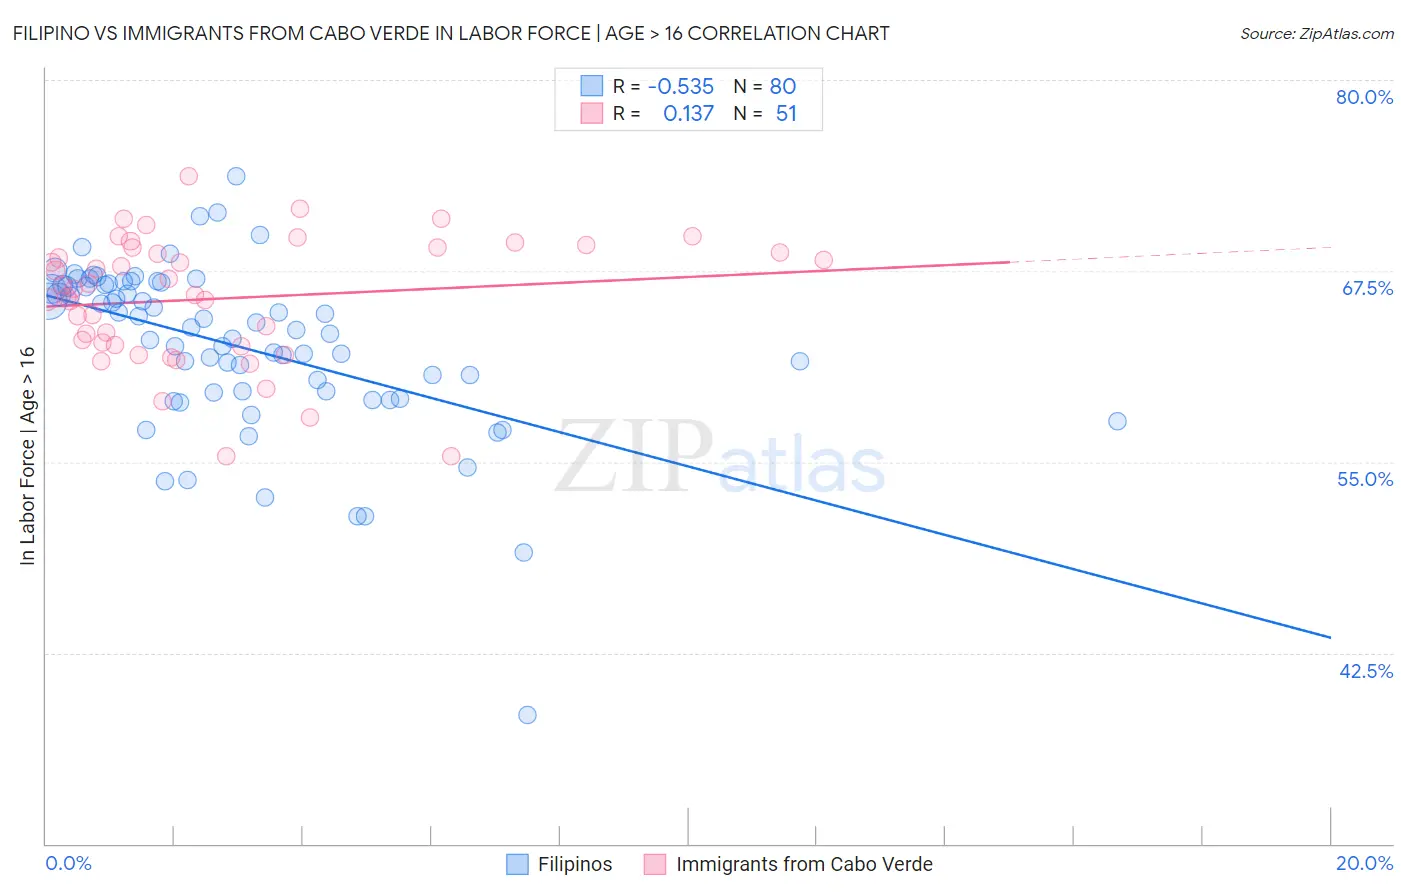
Filipino vs Immigrants from Cabo Verde In Labor Force | Age > 16 Correlation Chart
The statistical analysis conducted on geographies consisting of 254,350,604 people shows a substantial negative correlation between the proportion of Filipinos and labor force participation rate among population ages 16 and over in the United States with a correlation coefficient (R) of -0.535 and weighted average of 65.9%. Similarly, the statistical analysis conducted on geographies consisting of 38,158,316 people shows a poor positive correlation between the proportion of Immigrants from Cabo Verde and labor force participation rate among population ages 16 and over in the United States with a correlation coefficient (R) of 0.137 and weighted average of 67.3%, a difference of 2.1%.
In Labor Force | Age > 16 Correlation Summary
| Measurement | Filipino | Immigrants from Cabo Verde |
| Minimum | 38.4% | 55.4% |
| Maximum | 73.7% | 73.7% |
| Range | 35.3% | 18.3% |
| Mean | 62.6% | 65.7% |
| Median | 63.7% | 66.3% |
| Interquartile 25% (IQ1) | 59.6% | 62.6% |
| Interquartile 75% (IQ3) | 66.6% | 69.0% |
| Interquartile Range (IQR) | 7.0% | 6.4% |
| Standard Deviation (Sample) | 5.6% | 4.1% |
| Standard Deviation (Population) | 5.5% | 4.1% |
Similar Demographics by In Labor Force | Age > 16
Demographics Similar to Filipinos by In Labor Force | Age > 16
In terms of in labor force | age > 16, the demographic groups most similar to Filipinos are Bangladeshi (65.9%, a difference of 0.010%), Immigrants from Chile (65.9%, a difference of 0.030%), Immigrants from Cambodia (66.0%, a difference of 0.050%), Immigrants from Uruguay (66.0%, a difference of 0.050%), and Immigrants from Australia (65.9%, a difference of 0.050%).
| Demographics | Rating | Rank | In Labor Force | Age > 16 |
| Chileans | 99.2 /100 | #90 | Exceptional 66.0% |
| Iranians | 99.2 /100 | #91 | Exceptional 66.0% |
| Aleuts | 99.1 /100 | #92 | Exceptional 66.0% |
| Immigrants | South America | 99.1 /100 | #93 | Exceptional 66.0% |
| Immigrants | Cambodia | 99.1 /100 | #94 | Exceptional 66.0% |
| Immigrants | Uruguay | 99.1 /100 | #95 | Exceptional 66.0% |
| Bangladeshis | 98.9 /100 | #96 | Exceptional 65.9% |
| Filipinos | 98.9 /100 | #97 | Exceptional 65.9% |
| Immigrants | Chile | 98.7 /100 | #98 | Exceptional 65.9% |
| Immigrants | Australia | 98.7 /100 | #99 | Exceptional 65.9% |
| Okinawans | 98.7 /100 | #100 | Exceptional 65.9% |
| Immigrants | Colombia | 98.6 /100 | #101 | Exceptional 65.9% |
| Uruguayans | 98.6 /100 | #102 | Exceptional 65.9% |
| Immigrants | South Eastern Asia | 98.5 /100 | #103 | Exceptional 65.9% |
| Palestinians | 98.5 /100 | #104 | Exceptional 65.9% |
Demographics Similar to Immigrants from Cabo Verde by In Labor Force | Age > 16
In terms of in labor force | age > 16, the demographic groups most similar to Immigrants from Cabo Verde are Immigrants from Africa (67.4%, a difference of 0.030%), Ugandan (67.4%, a difference of 0.050%), Zimbabwean (67.3%, a difference of 0.080%), Cambodian (67.4%, a difference of 0.12%), and Immigrants from Morocco (67.2%, a difference of 0.16%).
| Demographics | Rating | Rank | In Labor Force | Age > 16 |
| Kenyans | 100.0 /100 | #19 | Exceptional 67.6% |
| Immigrants | Kenya | 100.0 /100 | #20 | Exceptional 67.6% |
| Tongans | 100.0 /100 | #21 | Exceptional 67.5% |
| Immigrants | Uganda | 100.0 /100 | #22 | Exceptional 67.5% |
| Cambodians | 100.0 /100 | #23 | Exceptional 67.4% |
| Ugandans | 100.0 /100 | #24 | Exceptional 67.4% |
| Immigrants | Africa | 100.0 /100 | #25 | Exceptional 67.4% |
| Immigrants | Cabo Verde | 100.0 /100 | #26 | Exceptional 67.3% |
| Zimbabweans | 100.0 /100 | #27 | Exceptional 67.3% |
| Immigrants | Morocco | 100.0 /100 | #28 | Exceptional 67.2% |
| Thais | 100.0 /100 | #29 | Exceptional 67.2% |
| Immigrants | Zaire | 100.0 /100 | #30 | Exceptional 67.2% |
| Ghanaians | 100.0 /100 | #31 | Exceptional 67.1% |
| Immigrants | Congo | 100.0 /100 | #32 | Exceptional 67.1% |
| Afghans | 100.0 /100 | #33 | Exceptional 67.1% |