Iroquois vs Swedish In Labor Force | Age > 16
COMPARE
Iroquois
Swedish
In Labor Force | Age > 16
In Labor Force | Age > 16 Comparison
Iroquois
Swedes
63.2%
IN LABOR FORCE | AGE > 16
0.0/ 100
METRIC RATING
312th/ 347
METRIC RANK
65.1%
IN LABOR FORCE | AGE > 16
47.4/ 100
METRIC RATING
176th/ 347
METRIC RANK
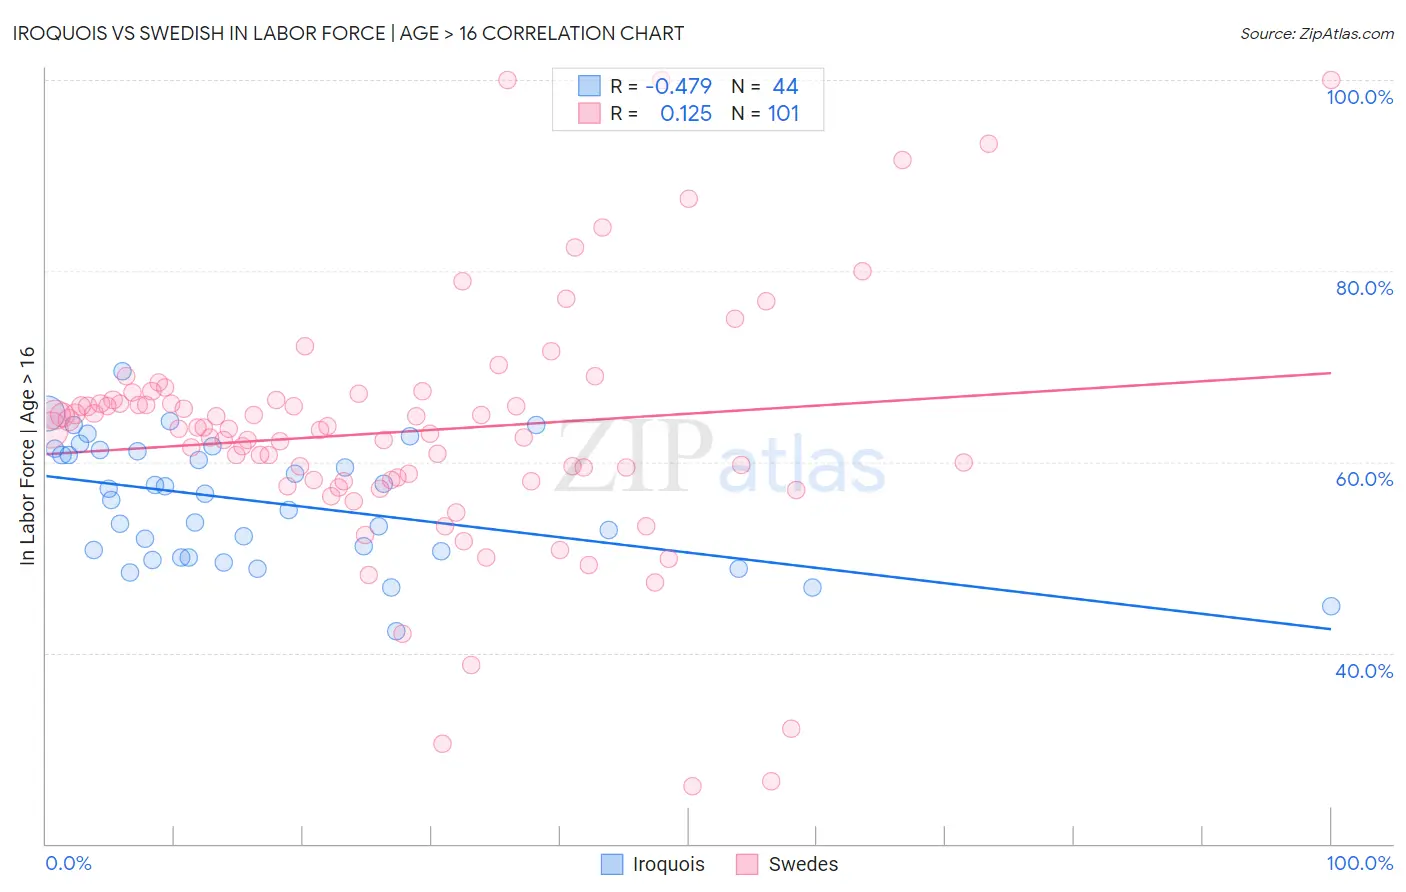
Iroquois vs Swedish In Labor Force | Age > 16 Correlation Chart
The statistical analysis conducted on geographies consisting of 207,293,305 people shows a moderate negative correlation between the proportion of Iroquois and labor force participation rate among population ages 16 and over in the United States with a correlation coefficient (R) of -0.479 and weighted average of 63.2%. Similarly, the statistical analysis conducted on geographies consisting of 539,248,336 people shows a poor positive correlation between the proportion of Swedes and labor force participation rate among population ages 16 and over in the United States with a correlation coefficient (R) of 0.125 and weighted average of 65.1%, a difference of 3.0%.
In Labor Force | Age > 16 Correlation Summary
| Measurement | Iroquois | Swedish |
| Minimum | 42.3% | 26.0% |
| Maximum | 69.6% | 100.0% |
| Range | 27.3% | 74.0% |
| Mean | 55.7% | 63.1% |
| Median | 56.3% | 63.4% |
| Interquartile 25% (IQ1) | 50.3% | 58.0% |
| Interquartile 75% (IQ3) | 61.2% | 66.5% |
| Interquartile Range (IQR) | 10.9% | 8.5% |
| Standard Deviation (Sample) | 6.3% | 13.0% |
| Standard Deviation (Population) | 6.3% | 12.9% |
Similar Demographics by In Labor Force | Age > 16
Demographics Similar to Iroquois by In Labor Force | Age > 16
In terms of in labor force | age > 16, the demographic groups most similar to Iroquois are Blackfeet (63.2%, a difference of 0.060%), Shoshone (63.2%, a difference of 0.070%), Chippewa (63.1%, a difference of 0.13%), Scotch-Irish (63.3%, a difference of 0.14%), and Yaqui (63.0%, a difference of 0.23%).
| Demographics | Rating | Rank | In Labor Force | Age > 16 |
| Osage | 0.0 /100 | #305 | Tragic 63.5% |
| Blacks/African Americans | 0.0 /100 | #306 | Tragic 63.4% |
| Central American Indians | 0.0 /100 | #307 | Tragic 63.4% |
| Pennsylvania Germans | 0.0 /100 | #308 | Tragic 63.4% |
| Scotch-Irish | 0.0 /100 | #309 | Tragic 63.3% |
| Shoshone | 0.0 /100 | #310 | Tragic 63.2% |
| Blackfeet | 0.0 /100 | #311 | Tragic 63.2% |
| Iroquois | 0.0 /100 | #312 | Tragic 63.2% |
| Chippewa | 0.0 /100 | #313 | Tragic 63.1% |
| Yaqui | 0.0 /100 | #314 | Tragic 63.0% |
| Potawatomi | 0.0 /100 | #315 | Tragic 62.8% |
| Yup'ik | 0.0 /100 | #316 | Tragic 62.7% |
| Kiowa | 0.0 /100 | #317 | Tragic 62.4% |
| Chickasaw | 0.0 /100 | #318 | Tragic 62.3% |
| Arapaho | 0.0 /100 | #319 | Tragic 62.1% |
Demographics Similar to Swedes by In Labor Force | Age > 16
In terms of in labor force | age > 16, the demographic groups most similar to Swedes are Eastern European (65.1%, a difference of 0.010%), Macedonian (65.1%, a difference of 0.030%), Nicaraguan (65.1%, a difference of 0.030%), Trinidadian and Tobagonian (65.1%, a difference of 0.030%), and Immigrants from Haiti (65.1%, a difference of 0.050%).
| Demographics | Rating | Rank | In Labor Force | Age > 16 |
| Arabs | 62.4 /100 | #169 | Good 65.2% |
| Immigrants | Israel | 61.7 /100 | #170 | Good 65.2% |
| Israelis | 61.6 /100 | #171 | Good 65.2% |
| Immigrants | Sweden | 61.3 /100 | #172 | Good 65.2% |
| Immigrants | Ukraine | 53.7 /100 | #173 | Average 65.1% |
| Macedonians | 50.0 /100 | #174 | Average 65.1% |
| Nicaraguans | 49.7 /100 | #175 | Average 65.1% |
| Swedes | 47.4 /100 | #176 | Average 65.1% |
| Eastern Europeans | 46.2 /100 | #177 | Average 65.1% |
| Trinidadians and Tobagonians | 45.2 /100 | #178 | Average 65.1% |
| Immigrants | Haiti | 43.3 /100 | #179 | Average 65.1% |
| Immigrants | Latvia | 42.9 /100 | #180 | Average 65.1% |
| Immigrants | Panama | 42.4 /100 | #181 | Average 65.1% |
| Immigrants | Nicaragua | 41.1 /100 | #182 | Average 65.1% |
| Soviet Union | 40.5 /100 | #183 | Average 65.0% |