Fijian vs Swedish In Labor Force | Age 16-19
COMPARE
Fijian
Swedish
In Labor Force | Age 16-19
In Labor Force | Age 16-19 Comparison
Fijians
Swedes
40.4%
IN LABOR FORCE | AGE 16-19
100.0/ 100
METRIC RATING
56th/ 347
METRIC RANK
44.1%
IN LABOR FORCE | AGE 16-19
100.0/ 100
METRIC RATING
11th/ 347
METRIC RANK
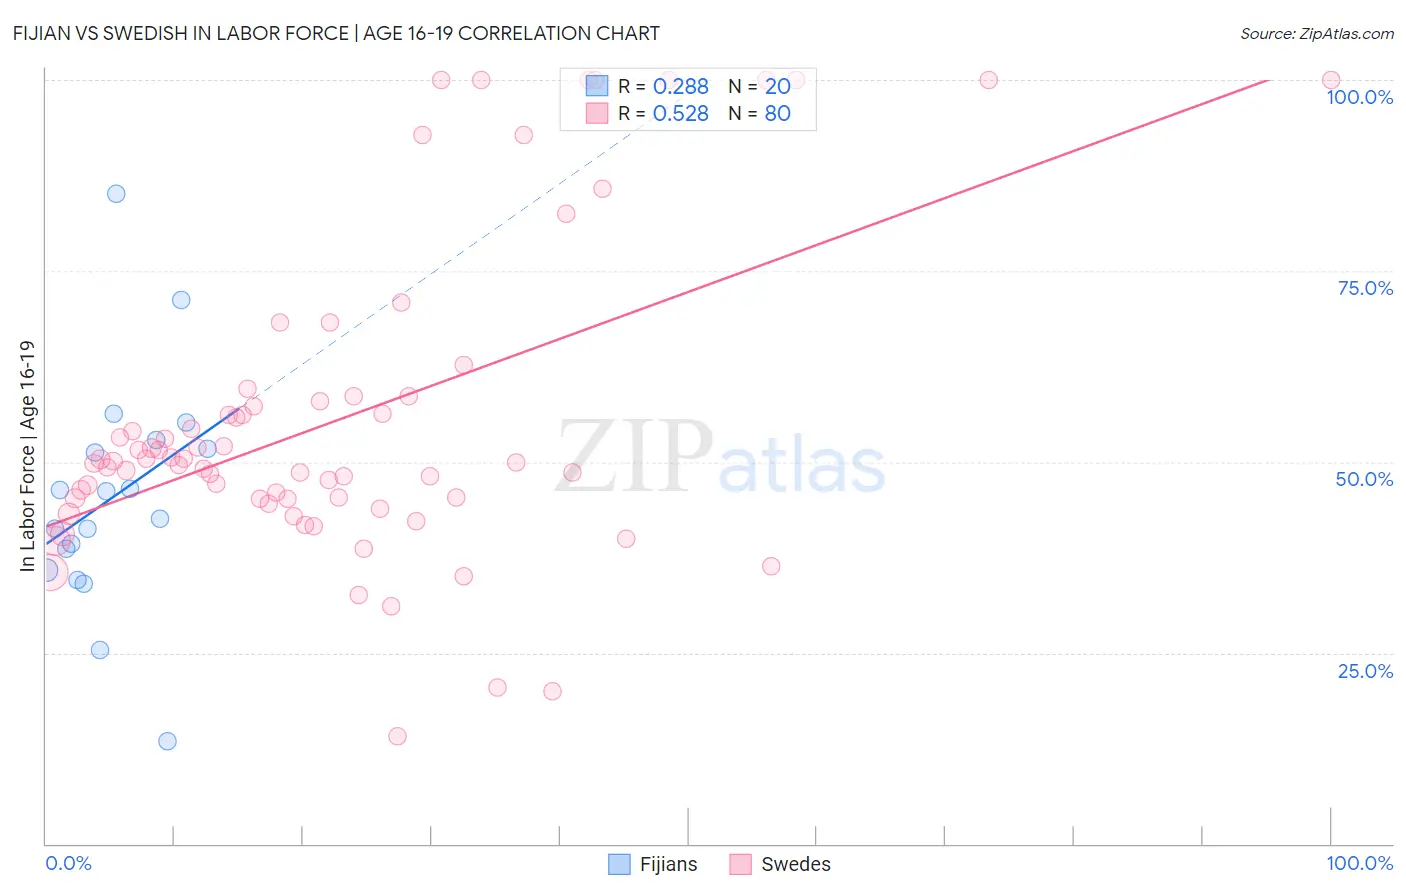
Fijian vs Swedish In Labor Force | Age 16-19 Correlation Chart
The statistical analysis conducted on geographies consisting of 55,922,250 people shows a weak positive correlation between the proportion of Fijians and labor force participation rate among population between the ages 16 and 19 in the United States with a correlation coefficient (R) of 0.288 and weighted average of 40.4%. Similarly, the statistical analysis conducted on geographies consisting of 536,421,636 people shows a substantial positive correlation between the proportion of Swedes and labor force participation rate among population between the ages 16 and 19 in the United States with a correlation coefficient (R) of 0.528 and weighted average of 44.1%, a difference of 9.1%.
In Labor Force | Age 16-19 Correlation Summary
| Measurement | Fijian | Swedish |
| Minimum | 13.4% | 14.1% |
| Maximum | 85.1% | 100.0% |
| Range | 71.7% | 85.9% |
| Mean | 45.4% | 55.6% |
| Median | 44.4% | 50.0% |
| Interquartile 25% (IQ1) | 37.2% | 45.2% |
| Interquartile 75% (IQ3) | 52.2% | 58.3% |
| Interquartile Range (IQR) | 15.0% | 13.1% |
| Standard Deviation (Sample) | 15.4% | 20.5% |
| Standard Deviation (Population) | 15.0% | 20.3% |
Similar Demographics by In Labor Force | Age 16-19
Demographics Similar to Fijians by In Labor Force | Age 16-19
In terms of in labor force | age 16-19, the demographic groups most similar to Fijians are Lithuanian (40.4%, a difference of 0.030%), Aleut (40.4%, a difference of 0.040%), British (40.5%, a difference of 0.090%), Tlingit-Haida (40.5%, a difference of 0.12%), and Immigrants from Kenya (40.5%, a difference of 0.15%).
| Demographics | Rating | Rank | In Labor Force | Age 16-19 |
| Cree | 100.0 /100 | #49 | Exceptional 40.8% |
| Indonesians | 100.0 /100 | #50 | Exceptional 40.7% |
| Immigrants | Zaire | 100.0 /100 | #51 | Exceptional 40.7% |
| Immigrants | Laos | 100.0 /100 | #52 | Exceptional 40.6% |
| Immigrants | Kenya | 100.0 /100 | #53 | Exceptional 40.5% |
| Tlingit-Haida | 100.0 /100 | #54 | Exceptional 40.5% |
| British | 100.0 /100 | #55 | Exceptional 40.5% |
| Fijians | 100.0 /100 | #56 | Exceptional 40.4% |
| Lithuanians | 100.0 /100 | #57 | Exceptional 40.4% |
| Aleuts | 100.0 /100 | #58 | Exceptional 40.4% |
| Slavs | 100.0 /100 | #59 | Exceptional 40.4% |
| Immigrants | Eastern Africa | 100.0 /100 | #60 | Exceptional 40.4% |
| Americans | 100.0 /100 | #61 | Exceptional 40.3% |
| Cherokee | 100.0 /100 | #62 | Exceptional 40.2% |
| Northern Europeans | 100.0 /100 | #63 | Exceptional 40.2% |
Demographics Similar to Swedes by In Labor Force | Age 16-19
In terms of in labor force | age 16-19, the demographic groups most similar to Swedes are German (44.2%, a difference of 0.080%), Finnish (43.9%, a difference of 0.46%), Dutch (43.8%, a difference of 0.64%), Chippewa (43.8%, a difference of 0.75%), and Cape Verdean (44.5%, a difference of 0.82%).
| Demographics | Rating | Rank | In Labor Force | Age 16-19 |
| Luxembourgers | 100.0 /100 | #4 | Exceptional 45.3% |
| Alaskan Athabascans | 100.0 /100 | #5 | Exceptional 45.2% |
| Somalis | 100.0 /100 | #6 | Exceptional 45.1% |
| Danes | 100.0 /100 | #7 | Exceptional 44.7% |
| Immigrants | Cabo Verde | 100.0 /100 | #8 | Exceptional 44.7% |
| Cape Verdeans | 100.0 /100 | #9 | Exceptional 44.5% |
| Germans | 100.0 /100 | #10 | Exceptional 44.2% |
| Swedes | 100.0 /100 | #11 | Exceptional 44.1% |
| Finns | 100.0 /100 | #12 | Exceptional 43.9% |
| Dutch | 100.0 /100 | #13 | Exceptional 43.8% |
| Chippewa | 100.0 /100 | #14 | Exceptional 43.8% |
| Slovenes | 100.0 /100 | #15 | Exceptional 43.7% |
| Czechs | 100.0 /100 | #16 | Exceptional 43.6% |
| Scandinavians | 100.0 /100 | #17 | Exceptional 43.6% |
| French Canadians | 100.0 /100 | #18 | Exceptional 43.6% |