Estonian vs Immigrants from Netherlands In Labor Force | Age > 16
COMPARE
Estonian
Immigrants from Netherlands
In Labor Force | Age > 16
In Labor Force | Age > 16 Comparison
Estonians
Immigrants from Netherlands
64.8%
IN LABOR FORCE | AGE > 16
13.1/ 100
METRIC RATING
214th/ 347
METRIC RANK
64.5%
IN LABOR FORCE | AGE > 16
3.4/ 100
METRIC RATING
242nd/ 347
METRIC RANK
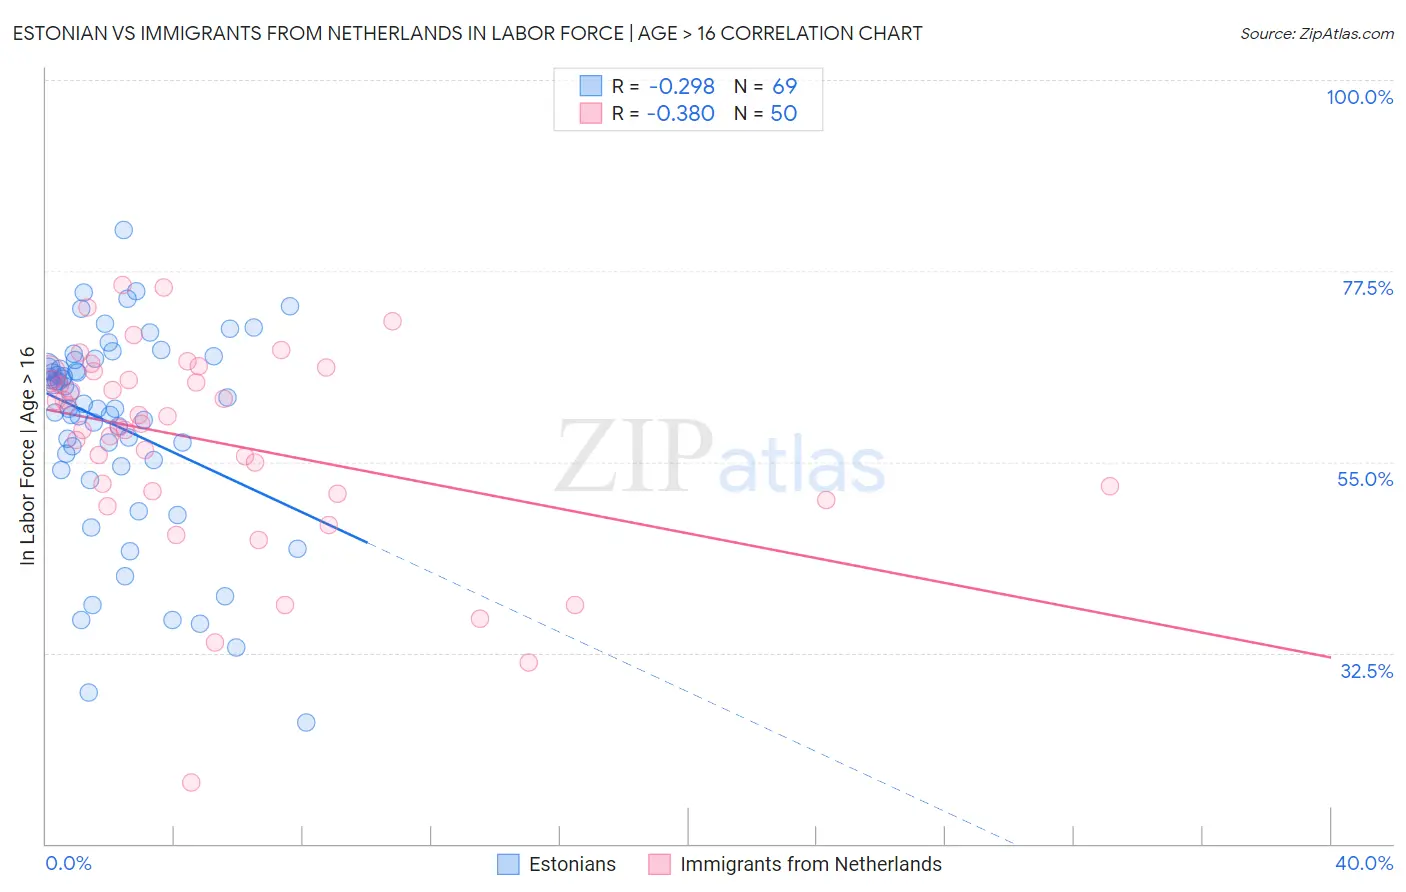
Estonian vs Immigrants from Netherlands In Labor Force | Age > 16 Correlation Chart
The statistical analysis conducted on geographies consisting of 123,528,478 people shows a weak negative correlation between the proportion of Estonians and labor force participation rate among population ages 16 and over in the United States with a correlation coefficient (R) of -0.298 and weighted average of 64.8%. Similarly, the statistical analysis conducted on geographies consisting of 237,884,135 people shows a mild negative correlation between the proportion of Immigrants from Netherlands and labor force participation rate among population ages 16 and over in the United States with a correlation coefficient (R) of -0.380 and weighted average of 64.5%, a difference of 0.41%.
In Labor Force | Age > 16 Correlation Summary
| Measurement | Estonian | Immigrants from Netherlands |
| Minimum | 24.3% | 17.2% |
| Maximum | 82.3% | 75.8% |
| Range | 58.0% | 58.5% |
| Mean | 59.2% | 57.4% |
| Median | 61.9% | 60.0% |
| Interquartile 25% (IQ1) | 54.8% | 51.5% |
| Interquartile 75% (IQ3) | 66.6% | 65.4% |
| Interquartile Range (IQR) | 11.7% | 13.9% |
| Standard Deviation (Sample) | 12.0% | 11.9% |
| Standard Deviation (Population) | 11.9% | 11.8% |
Similar Demographics by In Labor Force | Age > 16
Demographics Similar to Estonians by In Labor Force | Age > 16
In terms of in labor force | age > 16, the demographic groups most similar to Estonians are Fijian (64.8%, a difference of 0.020%), Alaskan Athabascan (64.8%, a difference of 0.020%), Maltese (64.8%, a difference of 0.020%), Immigrants from Czechoslovakia (64.8%, a difference of 0.020%), and Immigrants from Denmark (64.8%, a difference of 0.040%).
| Demographics | Rating | Rank | In Labor Force | Age > 16 |
| Immigrants | Latin America | 16.4 /100 | #207 | Poor 64.8% |
| Belizeans | 16.2 /100 | #208 | Poor 64.8% |
| Immigrants | Trinidad and Tobago | 15.6 /100 | #209 | Poor 64.8% |
| Immigrants | Denmark | 14.7 /100 | #210 | Poor 64.8% |
| Fijians | 14.1 /100 | #211 | Poor 64.8% |
| Alaskan Athabascans | 13.9 /100 | #212 | Poor 64.8% |
| Maltese | 13.8 /100 | #213 | Poor 64.8% |
| Estonians | 13.1 /100 | #214 | Poor 64.8% |
| Immigrants | Czechoslovakia | 12.3 /100 | #215 | Poor 64.8% |
| Belgians | 11.4 /100 | #216 | Poor 64.7% |
| U.S. Virgin Islanders | 11.3 /100 | #217 | Poor 64.7% |
| Alsatians | 10.7 /100 | #218 | Poor 64.7% |
| Immigrants | Central America | 10.5 /100 | #219 | Poor 64.7% |
| Alaska Natives | 9.9 /100 | #220 | Tragic 64.7% |
| Immigrants | Micronesia | 9.6 /100 | #221 | Tragic 64.7% |
Demographics Similar to Immigrants from Netherlands by In Labor Force | Age > 16
In terms of in labor force | age > 16, the demographic groups most similar to Immigrants from Netherlands are Immigrants from Dominica (64.5%, a difference of 0.010%), Immigrants from Lebanon (64.5%, a difference of 0.010%), Immigrants from Bangladesh (64.5%, a difference of 0.020%), Immigrants from Hungary (64.5%, a difference of 0.030%), and Tsimshian (64.5%, a difference of 0.030%).
| Demographics | Rating | Rank | In Labor Force | Age > 16 |
| Austrians | 4.6 /100 | #235 | Tragic 64.6% |
| Immigrants | Norway | 4.6 /100 | #236 | Tragic 64.6% |
| Italians | 4.6 /100 | #237 | Tragic 64.6% |
| Lebanese | 3.9 /100 | #238 | Tragic 64.5% |
| Immigrants | Hungary | 3.8 /100 | #239 | Tragic 64.5% |
| Immigrants | Bangladesh | 3.6 /100 | #240 | Tragic 64.5% |
| Immigrants | Dominica | 3.5 /100 | #241 | Tragic 64.5% |
| Immigrants | Netherlands | 3.4 /100 | #242 | Tragic 64.5% |
| Immigrants | Lebanon | 3.2 /100 | #243 | Tragic 64.5% |
| Tsimshian | 3.1 /100 | #244 | Tragic 64.5% |
| West Indians | 3.0 /100 | #245 | Tragic 64.5% |
| Immigrants | Caribbean | 2.3 /100 | #246 | Tragic 64.4% |
| Swiss | 2.1 /100 | #247 | Tragic 64.4% |
| Immigrants | Barbados | 2.1 /100 | #248 | Tragic 64.4% |
| Germans | 1.8 /100 | #249 | Tragic 64.4% |