Estonian vs Immigrants from Netherlands Child Poverty Under the Age of 5
COMPARE
Estonian
Immigrants from Netherlands
Child Poverty Under the Age of 5
Child Poverty Under the Age of 5 Comparison
Estonians
Immigrants from Netherlands
14.8%
CHILD POVERTY UNDER THE AGE OF 5
99.6/ 100
METRIC RATING
51st/ 347
METRIC RANK
15.6%
CHILD POVERTY UNDER THE AGE OF 5
97.6/ 100
METRIC RATING
84th/ 347
METRIC RANK
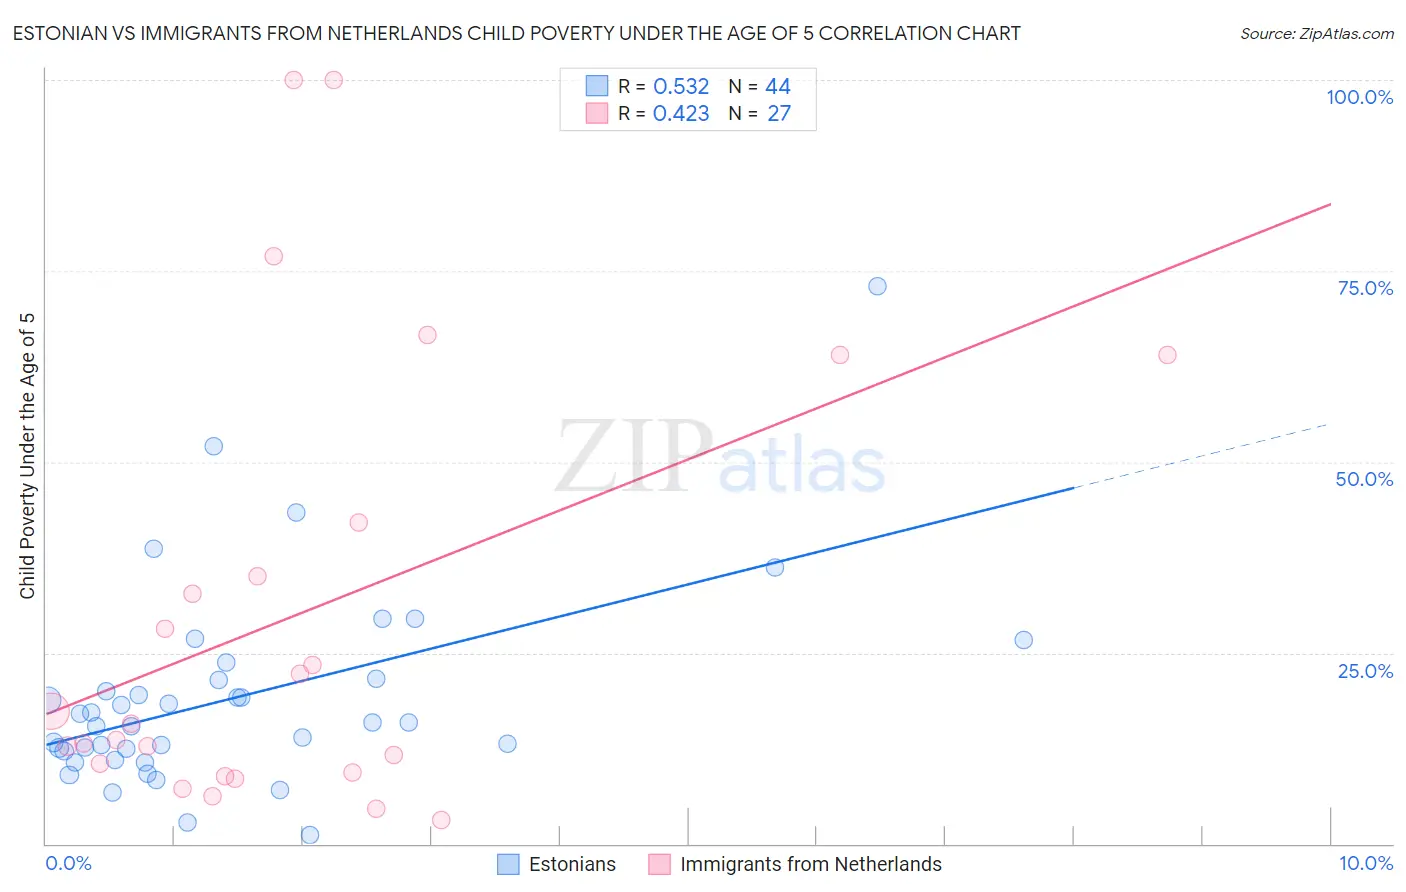
Estonian vs Immigrants from Netherlands Child Poverty Under the Age of 5 Correlation Chart
The statistical analysis conducted on geographies consisting of 120,177,315 people shows a substantial positive correlation between the proportion of Estonians and poverty level among children under the age of 5 in the United States with a correlation coefficient (R) of 0.532 and weighted average of 14.8%. Similarly, the statistical analysis conducted on geographies consisting of 229,684,544 people shows a moderate positive correlation between the proportion of Immigrants from Netherlands and poverty level among children under the age of 5 in the United States with a correlation coefficient (R) of 0.423 and weighted average of 15.6%, a difference of 5.2%.
Child Poverty Under the Age of 5 Correlation Summary
| Measurement | Estonian | Immigrants from Netherlands |
| Minimum | 1.2% | 3.0% |
| Maximum | 72.9% | 100.0% |
| Range | 71.7% | 97.0% |
| Mean | 19.2% | 30.0% |
| Median | 15.9% | 15.7% |
| Interquartile 25% (IQ1) | 12.3% | 9.3% |
| Interquartile 75% (IQ3) | 21.6% | 42.1% |
| Interquartile Range (IQR) | 9.2% | 32.8% |
| Standard Deviation (Sample) | 13.1% | 29.1% |
| Standard Deviation (Population) | 13.0% | 28.5% |
Similar Demographics by Child Poverty Under the Age of 5
Demographics Similar to Estonians by Child Poverty Under the Age of 5
In terms of child poverty under the age of 5, the demographic groups most similar to Estonians are Immigrants from Northern Europe (14.8%, a difference of 0.040%), Immigrants from Bulgaria (14.8%, a difference of 0.14%), Immigrants from Czechoslovakia (14.8%, a difference of 0.29%), Russian (14.8%, a difference of 0.39%), and Immigrants from Serbia (14.9%, a difference of 0.52%).
| Demographics | Rating | Rank | Child Poverty Under the Age of 5 |
| Immigrants | Philippines | 99.7 /100 | #44 | Exceptional 14.7% |
| Laotians | 99.6 /100 | #45 | Exceptional 14.7% |
| Tsimshian | 99.6 /100 | #46 | Exceptional 14.7% |
| Russians | 99.6 /100 | #47 | Exceptional 14.8% |
| Immigrants | Czechoslovakia | 99.6 /100 | #48 | Exceptional 14.8% |
| Immigrants | Bulgaria | 99.6 /100 | #49 | Exceptional 14.8% |
| Immigrants | Northern Europe | 99.6 /100 | #50 | Exceptional 14.8% |
| Estonians | 99.6 /100 | #51 | Exceptional 14.8% |
| Immigrants | Serbia | 99.5 /100 | #52 | Exceptional 14.9% |
| Luxembourgers | 99.4 /100 | #53 | Exceptional 14.9% |
| Immigrants | Israel | 99.4 /100 | #54 | Exceptional 14.9% |
| Danes | 99.4 /100 | #55 | Exceptional 14.9% |
| Immigrants | Pakistan | 99.4 /100 | #56 | Exceptional 14.9% |
| Egyptians | 99.4 /100 | #57 | Exceptional 14.9% |
| Swedes | 99.4 /100 | #58 | Exceptional 15.0% |
Demographics Similar to Immigrants from Netherlands by Child Poverty Under the Age of 5
In terms of child poverty under the age of 5, the demographic groups most similar to Immigrants from Netherlands are Chilean (15.6%, a difference of 0.020%), Immigrants from Latvia (15.6%, a difference of 0.16%), Immigrants from Malaysia (15.6%, a difference of 0.16%), Immigrants from Italy (15.6%, a difference of 0.18%), and Immigrants from Vietnam (15.6%, a difference of 0.24%).
| Demographics | Rating | Rank | Child Poverty Under the Age of 5 |
| Immigrants | Turkey | 98.3 /100 | #77 | Exceptional 15.4% |
| Sri Lankans | 98.1 /100 | #78 | Exceptional 15.5% |
| Australians | 98.0 /100 | #79 | Exceptional 15.5% |
| Italians | 97.9 /100 | #80 | Exceptional 15.5% |
| Czechs | 97.8 /100 | #81 | Exceptional 15.5% |
| Immigrants | Italy | 97.7 /100 | #82 | Exceptional 15.6% |
| Chileans | 97.6 /100 | #83 | Exceptional 15.6% |
| Immigrants | Netherlands | 97.6 /100 | #84 | Exceptional 15.6% |
| Immigrants | Latvia | 97.4 /100 | #85 | Exceptional 15.6% |
| Immigrants | Malaysia | 97.4 /100 | #86 | Exceptional 15.6% |
| Immigrants | Vietnam | 97.4 /100 | #87 | Exceptional 15.6% |
| Jordanians | 97.3 /100 | #88 | Exceptional 15.6% |
| Immigrants | Croatia | 97.3 /100 | #89 | Exceptional 15.6% |
| Immigrants | France | 97.3 /100 | #90 | Exceptional 15.6% |
| Poles | 97.2 /100 | #91 | Exceptional 15.7% |