Estonian vs Immigrants from Western Asia In Labor Force | Age > 16
COMPARE
Estonian
Immigrants from Western Asia
In Labor Force | Age > 16
In Labor Force | Age > 16 Comparison
Estonians
Immigrants from Western Asia
64.8%
IN LABOR FORCE | AGE > 16
13.1/ 100
METRIC RATING
214th/ 347
METRIC RANK
65.3%
IN LABOR FORCE | AGE > 16
67.3/ 100
METRIC RATING
166th/ 347
METRIC RANK
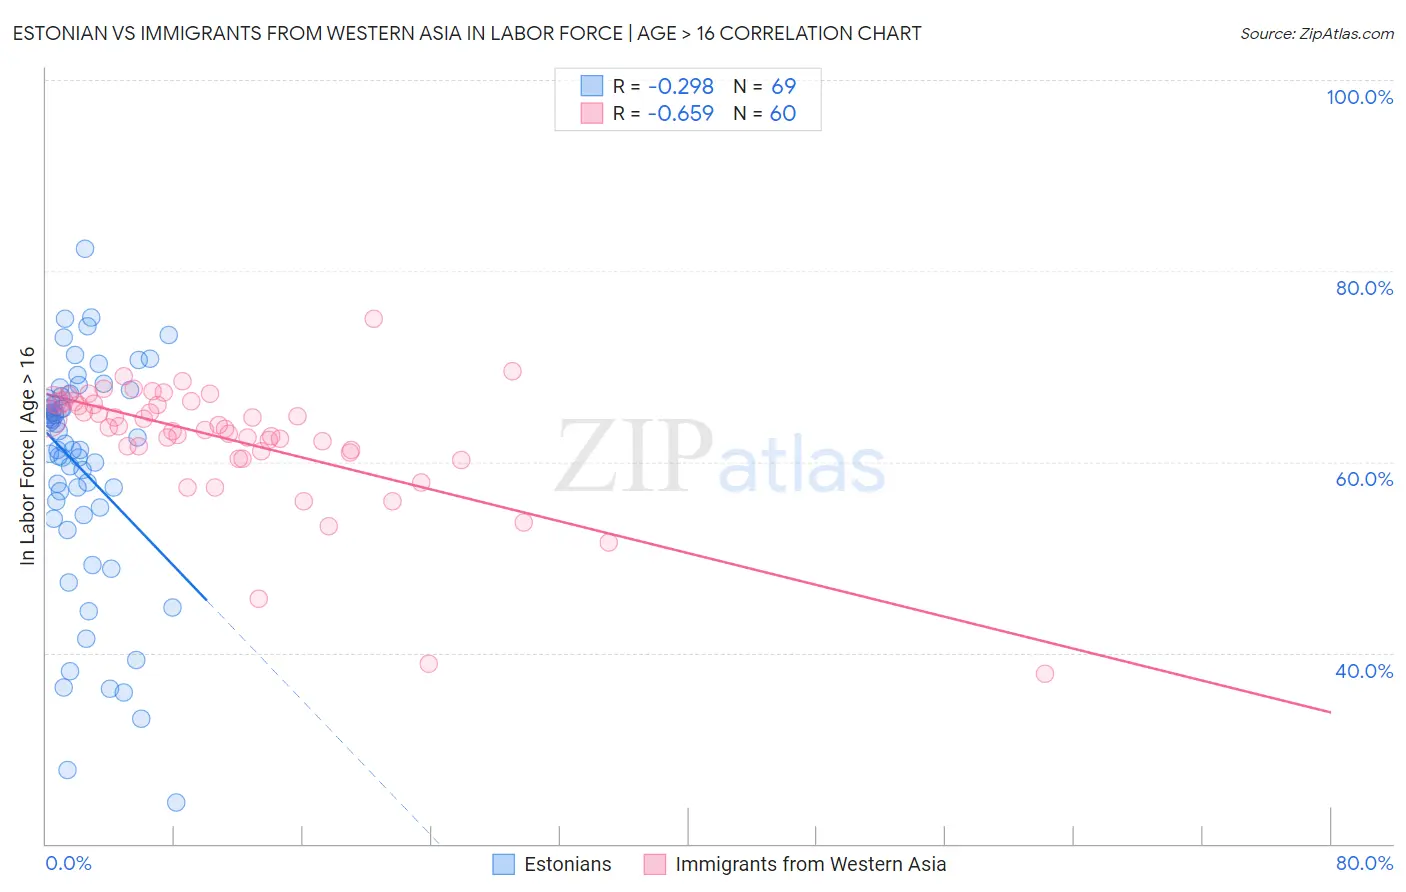
Estonian vs Immigrants from Western Asia In Labor Force | Age > 16 Correlation Chart
The statistical analysis conducted on geographies consisting of 123,528,478 people shows a weak negative correlation between the proportion of Estonians and labor force participation rate among population ages 16 and over in the United States with a correlation coefficient (R) of -0.298 and weighted average of 64.8%. Similarly, the statistical analysis conducted on geographies consisting of 404,444,876 people shows a significant negative correlation between the proportion of Immigrants from Western Asia and labor force participation rate among population ages 16 and over in the United States with a correlation coefficient (R) of -0.659 and weighted average of 65.3%, a difference of 0.73%.
In Labor Force | Age > 16 Correlation Summary
| Measurement | Estonian | Immigrants from Western Asia |
| Minimum | 24.3% | 37.8% |
| Maximum | 82.3% | 75.0% |
| Range | 58.0% | 37.2% |
| Mean | 59.2% | 62.3% |
| Median | 61.9% | 63.6% |
| Interquartile 25% (IQ1) | 54.8% | 61.0% |
| Interquartile 75% (IQ3) | 66.6% | 66.2% |
| Interquartile Range (IQR) | 11.7% | 5.2% |
| Standard Deviation (Sample) | 12.0% | 6.5% |
| Standard Deviation (Population) | 11.9% | 6.5% |
Similar Demographics by In Labor Force | Age > 16
Demographics Similar to Estonians by In Labor Force | Age > 16
In terms of in labor force | age > 16, the demographic groups most similar to Estonians are Fijian (64.8%, a difference of 0.020%), Alaskan Athabascan (64.8%, a difference of 0.020%), Maltese (64.8%, a difference of 0.020%), Immigrants from Czechoslovakia (64.8%, a difference of 0.020%), and Immigrants from Denmark (64.8%, a difference of 0.040%).
| Demographics | Rating | Rank | In Labor Force | Age > 16 |
| Immigrants | Latin America | 16.4 /100 | #207 | Poor 64.8% |
| Belizeans | 16.2 /100 | #208 | Poor 64.8% |
| Immigrants | Trinidad and Tobago | 15.6 /100 | #209 | Poor 64.8% |
| Immigrants | Denmark | 14.7 /100 | #210 | Poor 64.8% |
| Fijians | 14.1 /100 | #211 | Poor 64.8% |
| Alaskan Athabascans | 13.9 /100 | #212 | Poor 64.8% |
| Maltese | 13.8 /100 | #213 | Poor 64.8% |
| Estonians | 13.1 /100 | #214 | Poor 64.8% |
| Immigrants | Czechoslovakia | 12.3 /100 | #215 | Poor 64.8% |
| Belgians | 11.4 /100 | #216 | Poor 64.7% |
| U.S. Virgin Islanders | 11.3 /100 | #217 | Poor 64.7% |
| Alsatians | 10.7 /100 | #218 | Poor 64.7% |
| Immigrants | Central America | 10.5 /100 | #219 | Poor 64.7% |
| Alaska Natives | 9.9 /100 | #220 | Tragic 64.7% |
| Immigrants | Micronesia | 9.6 /100 | #221 | Tragic 64.7% |
Demographics Similar to Immigrants from Western Asia by In Labor Force | Age > 16
In terms of in labor force | age > 16, the demographic groups most similar to Immigrants from Western Asia are Immigrants from Kazakhstan (65.3%, a difference of 0.010%), Danish (65.3%, a difference of 0.020%), Immigrants from Belarus (65.2%, a difference of 0.020%), South African (65.3%, a difference of 0.030%), and Australian (65.3%, a difference of 0.050%).
| Demographics | Rating | Rank | In Labor Force | Age > 16 |
| Immigrants | Syria | 74.6 /100 | #159 | Good 65.3% |
| Immigrants | South Africa | 73.5 /100 | #160 | Good 65.3% |
| Australians | 71.3 /100 | #161 | Good 65.3% |
| Albanians | 70.8 /100 | #162 | Good 65.3% |
| South Africans | 69.8 /100 | #163 | Good 65.3% |
| Danes | 68.8 /100 | #164 | Good 65.3% |
| Immigrants | Kazakhstan | 68.1 /100 | #165 | Good 65.3% |
| Immigrants | Western Asia | 67.3 /100 | #166 | Good 65.3% |
| Immigrants | Belarus | 66.0 /100 | #167 | Good 65.2% |
| Serbians | 63.5 /100 | #168 | Good 65.2% |
| Arabs | 62.4 /100 | #169 | Good 65.2% |
| Immigrants | Israel | 61.7 /100 | #170 | Good 65.2% |
| Israelis | 61.6 /100 | #171 | Good 65.2% |
| Immigrants | Sweden | 61.3 /100 | #172 | Good 65.2% |
| Immigrants | Ukraine | 53.7 /100 | #173 | Average 65.1% |