Estonian vs Hungarian In Labor Force | Age 25-29
COMPARE
Estonian
Hungarian
In Labor Force | Age 25-29
In Labor Force | Age 25-29 Comparison
Estonians
Hungarians
85.5%
IN LABOR FORCE | AGE 25-29
99.6/ 100
METRIC RATING
57th/ 347
METRIC RANK
84.6%
IN LABOR FORCE | AGE 25-29
47.8/ 100
METRIC RATING
175th/ 347
METRIC RANK
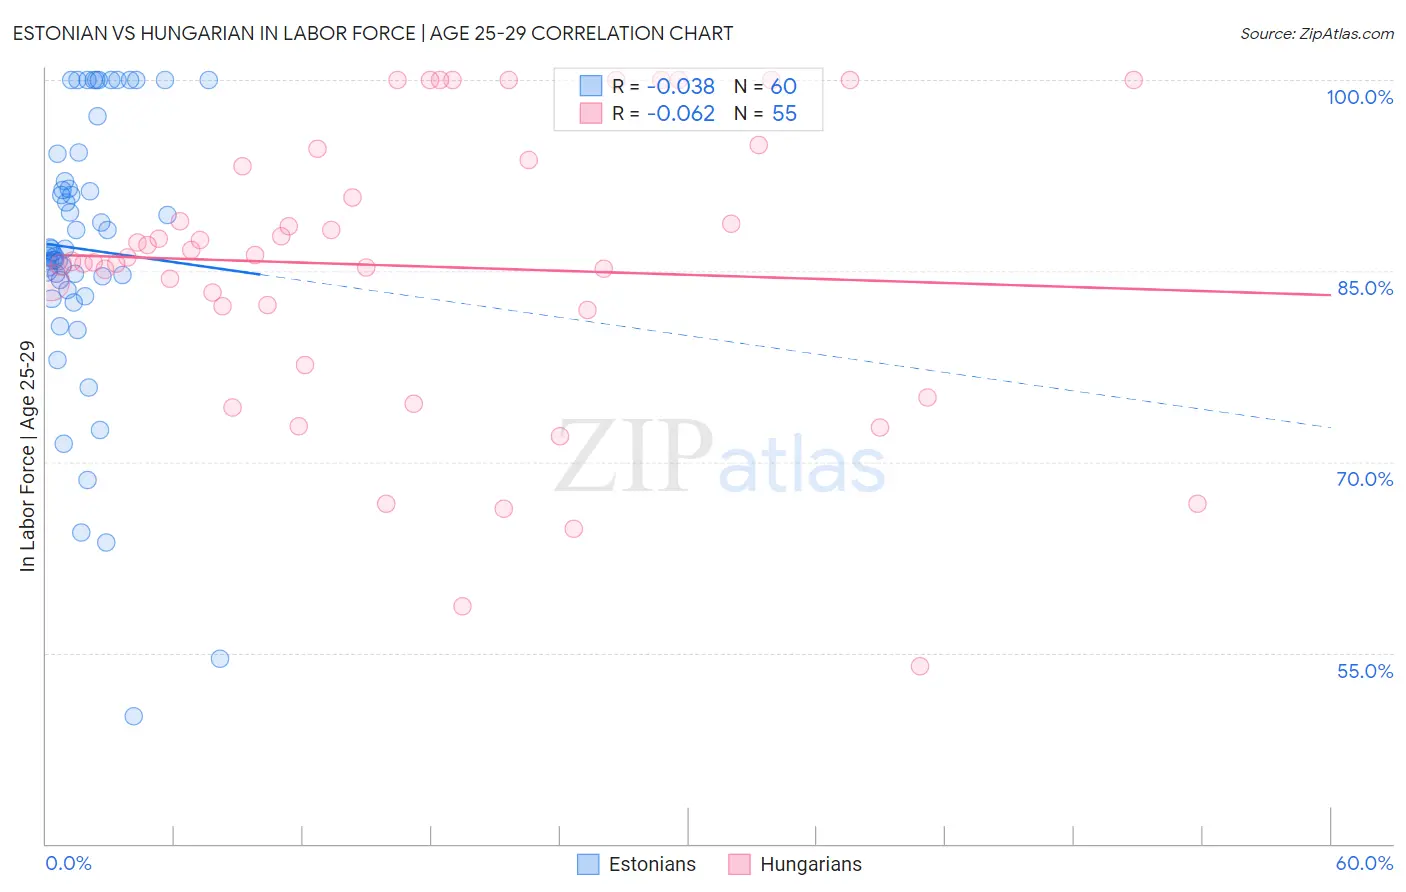
Estonian vs Hungarian In Labor Force | Age 25-29 Correlation Chart
The statistical analysis conducted on geographies consisting of 123,516,620 people shows no correlation between the proportion of Estonians and labor force participation rate among population between the ages 25 and 29 in the United States with a correlation coefficient (R) of -0.038 and weighted average of 85.5%. Similarly, the statistical analysis conducted on geographies consisting of 485,787,626 people shows a slight negative correlation between the proportion of Hungarians and labor force participation rate among population between the ages 25 and 29 in the United States with a correlation coefficient (R) of -0.062 and weighted average of 84.6%, a difference of 1.0%.
In Labor Force | Age 25-29 Correlation Summary
| Measurement | Estonian | Hungarian |
| Minimum | 50.0% | 53.9% |
| Maximum | 100.0% | 100.0% |
| Range | 50.0% | 46.1% |
| Mean | 86.7% | 85.4% |
| Median | 86.6% | 86.0% |
| Interquartile 25% (IQ1) | 83.9% | 81.9% |
| Interquartile 75% (IQ3) | 93.1% | 93.7% |
| Interquartile Range (IQR) | 9.2% | 11.8% |
| Standard Deviation (Sample) | 10.9% | 11.3% |
| Standard Deviation (Population) | 10.8% | 11.2% |
Similar Demographics by In Labor Force | Age 25-29
Demographics Similar to Estonians by In Labor Force | Age 25-29
In terms of in labor force | age 25-29, the demographic groups most similar to Estonians are Eastern European (85.5%, a difference of 0.010%), Greek (85.5%, a difference of 0.010%), Immigrants from Morocco (85.5%, a difference of 0.010%), Immigrants from Brazil (85.5%, a difference of 0.040%), and Thai (85.5%, a difference of 0.040%).
| Demographics | Rating | Rank | In Labor Force | Age 25-29 |
| Yugoslavians | 99.8 /100 | #50 | Exceptional 85.6% |
| Immigrants | Latvia | 99.8 /100 | #51 | Exceptional 85.6% |
| Immigrants | Poland | 99.7 /100 | #52 | Exceptional 85.6% |
| Belgians | 99.7 /100 | #53 | Exceptional 85.5% |
| Albanians | 99.7 /100 | #54 | Exceptional 85.5% |
| Immigrants | Brazil | 99.7 /100 | #55 | Exceptional 85.5% |
| Eastern Europeans | 99.6 /100 | #56 | Exceptional 85.5% |
| Estonians | 99.6 /100 | #57 | Exceptional 85.5% |
| Greeks | 99.6 /100 | #58 | Exceptional 85.5% |
| Immigrants | Morocco | 99.5 /100 | #59 | Exceptional 85.5% |
| Thais | 99.5 /100 | #60 | Exceptional 85.5% |
| Serbians | 99.5 /100 | #61 | Exceptional 85.5% |
| Taiwanese | 99.4 /100 | #62 | Exceptional 85.4% |
| Immigrants | Kenya | 99.4 /100 | #63 | Exceptional 85.4% |
| Immigrants | Italy | 99.3 /100 | #64 | Exceptional 85.4% |
Demographics Similar to Hungarians by In Labor Force | Age 25-29
In terms of in labor force | age 25-29, the demographic groups most similar to Hungarians are Malaysian (84.6%, a difference of 0.010%), Immigrants from Vietnam (84.7%, a difference of 0.020%), Immigrants from Western Europe (84.7%, a difference of 0.020%), Assyrian/Chaldean/Syriac (84.7%, a difference of 0.020%), and Palestinian (84.7%, a difference of 0.020%).
| Demographics | Rating | Rank | In Labor Force | Age 25-29 |
| South Americans | 54.9 /100 | #168 | Average 84.7% |
| Celtics | 52.5 /100 | #169 | Average 84.7% |
| Tongans | 52.4 /100 | #170 | Average 84.7% |
| Immigrants | Vietnam | 50.5 /100 | #171 | Average 84.7% |
| Immigrants | Western Europe | 50.4 /100 | #172 | Average 84.7% |
| Assyrians/Chaldeans/Syriacs | 50.2 /100 | #173 | Average 84.7% |
| Palestinians | 50.0 /100 | #174 | Average 84.7% |
| Hungarians | 47.8 /100 | #175 | Average 84.6% |
| Malaysians | 46.8 /100 | #176 | Average 84.6% |
| Immigrants | China | 45.7 /100 | #177 | Average 84.6% |
| Immigrants | Thailand | 45.2 /100 | #178 | Average 84.6% |
| Immigrants | Argentina | 44.0 /100 | #179 | Average 84.6% |
| Immigrants | South America | 42.9 /100 | #180 | Average 84.6% |
| Immigrants | Norway | 41.9 /100 | #181 | Average 84.6% |
| Europeans | 40.3 /100 | #182 | Average 84.6% |