Estonian vs Guamanian/Chamorro In Labor Force | Age 25-29
COMPARE
Estonian
Guamanian/Chamorro
In Labor Force | Age 25-29
In Labor Force | Age 25-29 Comparison
Estonians
Guamanians/Chamorros
85.5%
IN LABOR FORCE | AGE 25-29
99.6/ 100
METRIC RATING
57th/ 347
METRIC RANK
83.9%
IN LABOR FORCE | AGE 25-29
0.9/ 100
METRIC RATING
236th/ 347
METRIC RANK
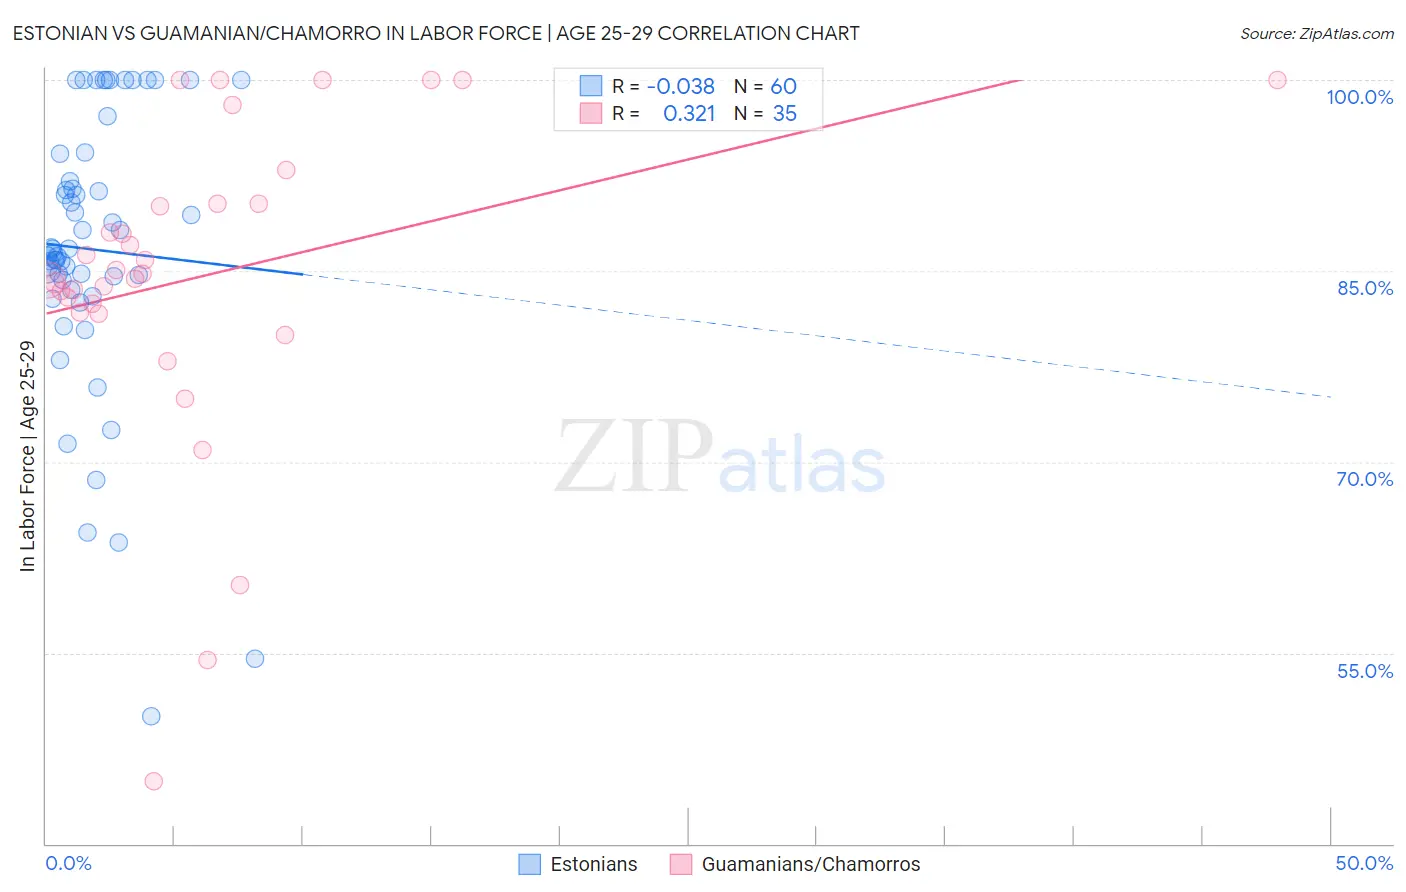
Estonian vs Guamanian/Chamorro In Labor Force | Age 25-29 Correlation Chart
The statistical analysis conducted on geographies consisting of 123,516,620 people shows no correlation between the proportion of Estonians and labor force participation rate among population between the ages 25 and 29 in the United States with a correlation coefficient (R) of -0.038 and weighted average of 85.5%. Similarly, the statistical analysis conducted on geographies consisting of 221,933,719 people shows a mild positive correlation between the proportion of Guamanians/Chamorros and labor force participation rate among population between the ages 25 and 29 in the United States with a correlation coefficient (R) of 0.321 and weighted average of 83.9%, a difference of 1.9%.
In Labor Force | Age 25-29 Correlation Summary
| Measurement | Estonian | Guamanian/Chamorro |
| Minimum | 50.0% | 44.9% |
| Maximum | 100.0% | 100.0% |
| Range | 50.0% | 55.1% |
| Mean | 86.7% | 84.6% |
| Median | 86.6% | 84.8% |
| Interquartile 25% (IQ1) | 83.9% | 81.8% |
| Interquartile 75% (IQ3) | 93.1% | 90.3% |
| Interquartile Range (IQR) | 9.2% | 8.6% |
| Standard Deviation (Sample) | 10.9% | 12.4% |
| Standard Deviation (Population) | 10.8% | 12.3% |
Similar Demographics by In Labor Force | Age 25-29
Demographics Similar to Estonians by In Labor Force | Age 25-29
In terms of in labor force | age 25-29, the demographic groups most similar to Estonians are Eastern European (85.5%, a difference of 0.010%), Greek (85.5%, a difference of 0.010%), Immigrants from Morocco (85.5%, a difference of 0.010%), Immigrants from Brazil (85.5%, a difference of 0.040%), and Thai (85.5%, a difference of 0.040%).
| Demographics | Rating | Rank | In Labor Force | Age 25-29 |
| Yugoslavians | 99.8 /100 | #50 | Exceptional 85.6% |
| Immigrants | Latvia | 99.8 /100 | #51 | Exceptional 85.6% |
| Immigrants | Poland | 99.7 /100 | #52 | Exceptional 85.6% |
| Belgians | 99.7 /100 | #53 | Exceptional 85.5% |
| Albanians | 99.7 /100 | #54 | Exceptional 85.5% |
| Immigrants | Brazil | 99.7 /100 | #55 | Exceptional 85.5% |
| Eastern Europeans | 99.6 /100 | #56 | Exceptional 85.5% |
| Estonians | 99.6 /100 | #57 | Exceptional 85.5% |
| Greeks | 99.6 /100 | #58 | Exceptional 85.5% |
| Immigrants | Morocco | 99.5 /100 | #59 | Exceptional 85.5% |
| Thais | 99.5 /100 | #60 | Exceptional 85.5% |
| Serbians | 99.5 /100 | #61 | Exceptional 85.5% |
| Taiwanese | 99.4 /100 | #62 | Exceptional 85.4% |
| Immigrants | Kenya | 99.4 /100 | #63 | Exceptional 85.4% |
| Immigrants | Italy | 99.3 /100 | #64 | Exceptional 85.4% |
Demographics Similar to Guamanians/Chamorros by In Labor Force | Age 25-29
In terms of in labor force | age 25-29, the demographic groups most similar to Guamanians/Chamorros are Iraqi (83.9%, a difference of 0.0%), Immigrants (83.9%, a difference of 0.0%), Barbadian (83.9%, a difference of 0.020%), Immigrants from Uzbekistan (83.9%, a difference of 0.030%), and Jamaican (83.9%, a difference of 0.040%).
| Demographics | Rating | Rank | In Labor Force | Age 25-29 |
| Immigrants | Oceania | 5.0 /100 | #229 | Tragic 84.2% |
| Whites/Caucasians | 4.8 /100 | #230 | Tragic 84.2% |
| Immigrants | Philippines | 4.7 /100 | #231 | Tragic 84.2% |
| Panamanians | 4.5 /100 | #232 | Tragic 84.2% |
| Immigrants | Western Asia | 2.7 /100 | #233 | Tragic 84.1% |
| Barbadians | 1.0 /100 | #234 | Tragic 83.9% |
| Iraqis | 0.9 /100 | #235 | Tragic 83.9% |
| Guamanians/Chamorros | 0.9 /100 | #236 | Tragic 83.9% |
| Immigrants | Immigrants | 0.9 /100 | #237 | Tragic 83.9% |
| Immigrants | Uzbekistan | 0.8 /100 | #238 | Tragic 83.9% |
| Jamaicans | 0.8 /100 | #239 | Tragic 83.9% |
| Trinidadians and Tobagonians | 0.7 /100 | #240 | Tragic 83.9% |
| Alsatians | 0.7 /100 | #241 | Tragic 83.9% |
| U.S. Virgin Islanders | 0.6 /100 | #242 | Tragic 83.8% |
| Salvadorans | 0.5 /100 | #243 | Tragic 83.8% |