Immigrants from Spain vs Hungarian In Labor Force | Age 25-29
COMPARE
Immigrants from Spain
Hungarian
In Labor Force | Age 25-29
In Labor Force | Age 25-29 Comparison
Immigrants from Spain
Hungarians
84.7%
IN LABOR FORCE | AGE 25-29
56.9/ 100
METRIC RATING
166th/ 347
METRIC RANK
84.6%
IN LABOR FORCE | AGE 25-29
47.8/ 100
METRIC RATING
175th/ 347
METRIC RANK
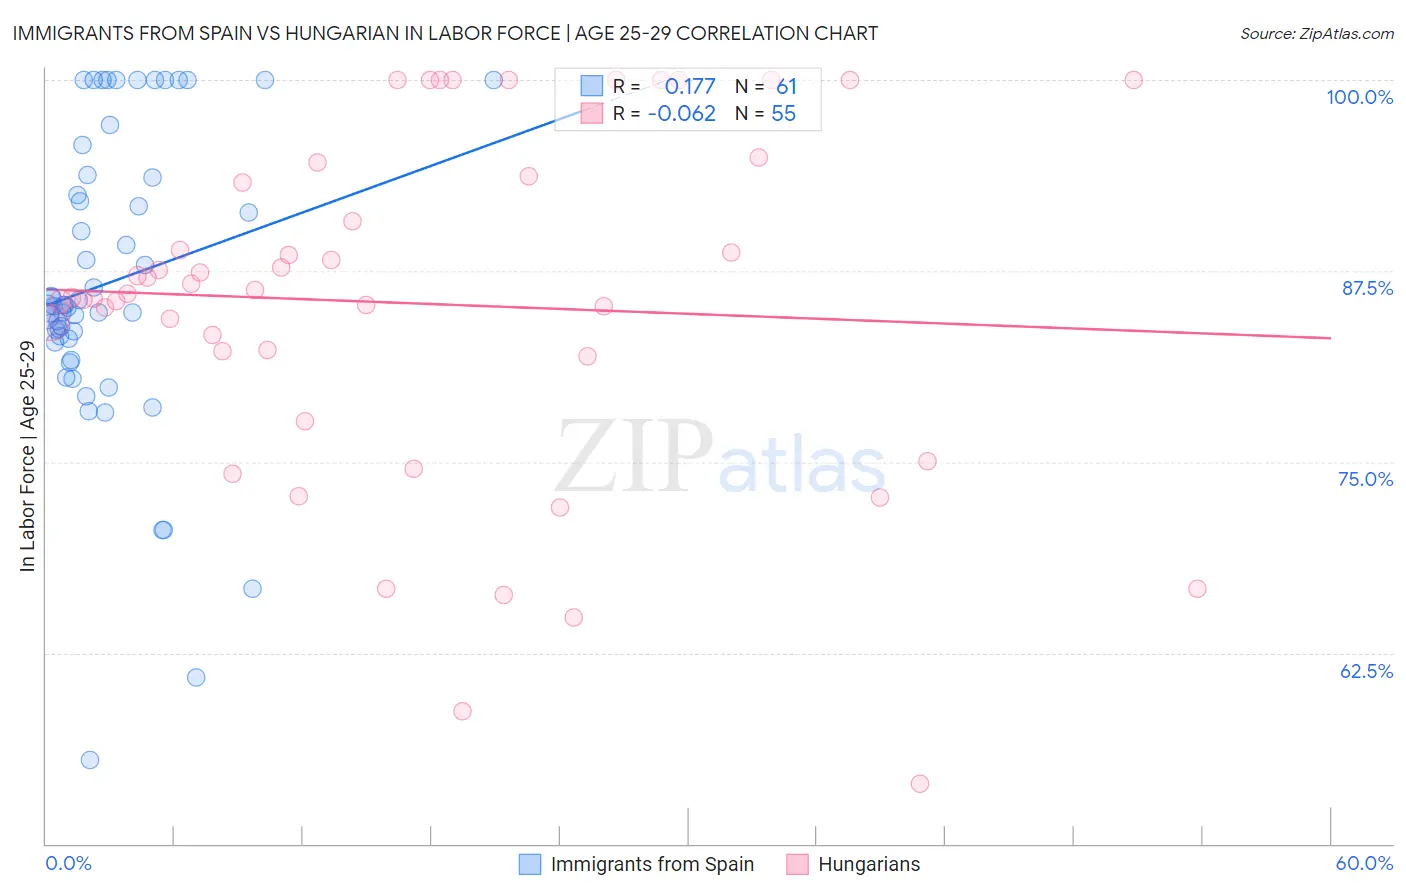
Immigrants from Spain vs Hungarian In Labor Force | Age 25-29 Correlation Chart
The statistical analysis conducted on geographies consisting of 239,645,733 people shows a poor positive correlation between the proportion of Immigrants from Spain and labor force participation rate among population between the ages 25 and 29 in the United States with a correlation coefficient (R) of 0.177 and weighted average of 84.7%. Similarly, the statistical analysis conducted on geographies consisting of 485,787,626 people shows a slight negative correlation between the proportion of Hungarians and labor force participation rate among population between the ages 25 and 29 in the United States with a correlation coefficient (R) of -0.062 and weighted average of 84.6%, a difference of 0.070%.
In Labor Force | Age 25-29 Correlation Summary
| Measurement | Immigrants from Spain | Hungarian |
| Minimum | 55.5% | 53.9% |
| Maximum | 100.0% | 100.0% |
| Range | 44.5% | 46.1% |
| Mean | 86.8% | 85.4% |
| Median | 85.3% | 86.0% |
| Interquartile 25% (IQ1) | 82.9% | 81.9% |
| Interquartile 75% (IQ3) | 93.7% | 93.7% |
| Interquartile Range (IQR) | 10.8% | 11.8% |
| Standard Deviation (Sample) | 9.7% | 11.3% |
| Standard Deviation (Population) | 9.6% | 11.2% |
Demographics Similar to Immigrants from Spain and Hungarians by In Labor Force | Age 25-29
In terms of in labor force | age 25-29, the demographic groups most similar to Immigrants from Spain are Immigrants from Burma/Myanmar (84.7%, a difference of 0.0%), Indonesian (84.7%, a difference of 0.0%), Immigrants from Peru (84.7%, a difference of 0.010%), Canadian (84.7%, a difference of 0.010%), and Immigrants from Colombia (84.7%, a difference of 0.010%). Similarly, the demographic groups most similar to Hungarians are Malaysian (84.6%, a difference of 0.010%), Immigrants from Vietnam (84.7%, a difference of 0.020%), Immigrants from Western Europe (84.7%, a difference of 0.020%), Assyrian/Chaldean/Syriac (84.7%, a difference of 0.020%), and Palestinian (84.7%, a difference of 0.020%).
| Demographics | Rating | Rank | In Labor Force | Age 25-29 |
| Immigrants | Peru | 58.6 /100 | #160 | Average 84.7% |
| Canadians | 58.5 /100 | #161 | Average 84.7% |
| Immigrants | Colombia | 58.3 /100 | #162 | Average 84.7% |
| Argentineans | 57.9 /100 | #163 | Average 84.7% |
| Ghanaians | 57.6 /100 | #164 | Average 84.7% |
| Immigrants | Burma/Myanmar | 57.4 /100 | #165 | Average 84.7% |
| Immigrants | Spain | 56.9 /100 | #166 | Average 84.7% |
| Indonesians | 56.5 /100 | #167 | Average 84.7% |
| South Americans | 54.9 /100 | #168 | Average 84.7% |
| Celtics | 52.5 /100 | #169 | Average 84.7% |
| Tongans | 52.4 /100 | #170 | Average 84.7% |
| Immigrants | Vietnam | 50.5 /100 | #171 | Average 84.7% |
| Immigrants | Western Europe | 50.4 /100 | #172 | Average 84.7% |
| Assyrians/Chaldeans/Syriacs | 50.2 /100 | #173 | Average 84.7% |
| Palestinians | 50.0 /100 | #174 | Average 84.7% |
| Hungarians | 47.8 /100 | #175 | Average 84.6% |
| Malaysians | 46.8 /100 | #176 | Average 84.6% |
| Immigrants | China | 45.7 /100 | #177 | Average 84.6% |
| Immigrants | Thailand | 45.2 /100 | #178 | Average 84.6% |
| Immigrants | Argentina | 44.0 /100 | #179 | Average 84.6% |
| Immigrants | South America | 42.9 /100 | #180 | Average 84.6% |