Estonian vs Slavic In Labor Force | Age 25-29
COMPARE
Estonian
Slavic
In Labor Force | Age 25-29
In Labor Force | Age 25-29 Comparison
Estonians
Slavs
85.5%
IN LABOR FORCE | AGE 25-29
99.6/ 100
METRIC RATING
57th/ 347
METRIC RANK
85.1%
IN LABOR FORCE | AGE 25-29
93.7/ 100
METRIC RATING
102nd/ 347
METRIC RANK
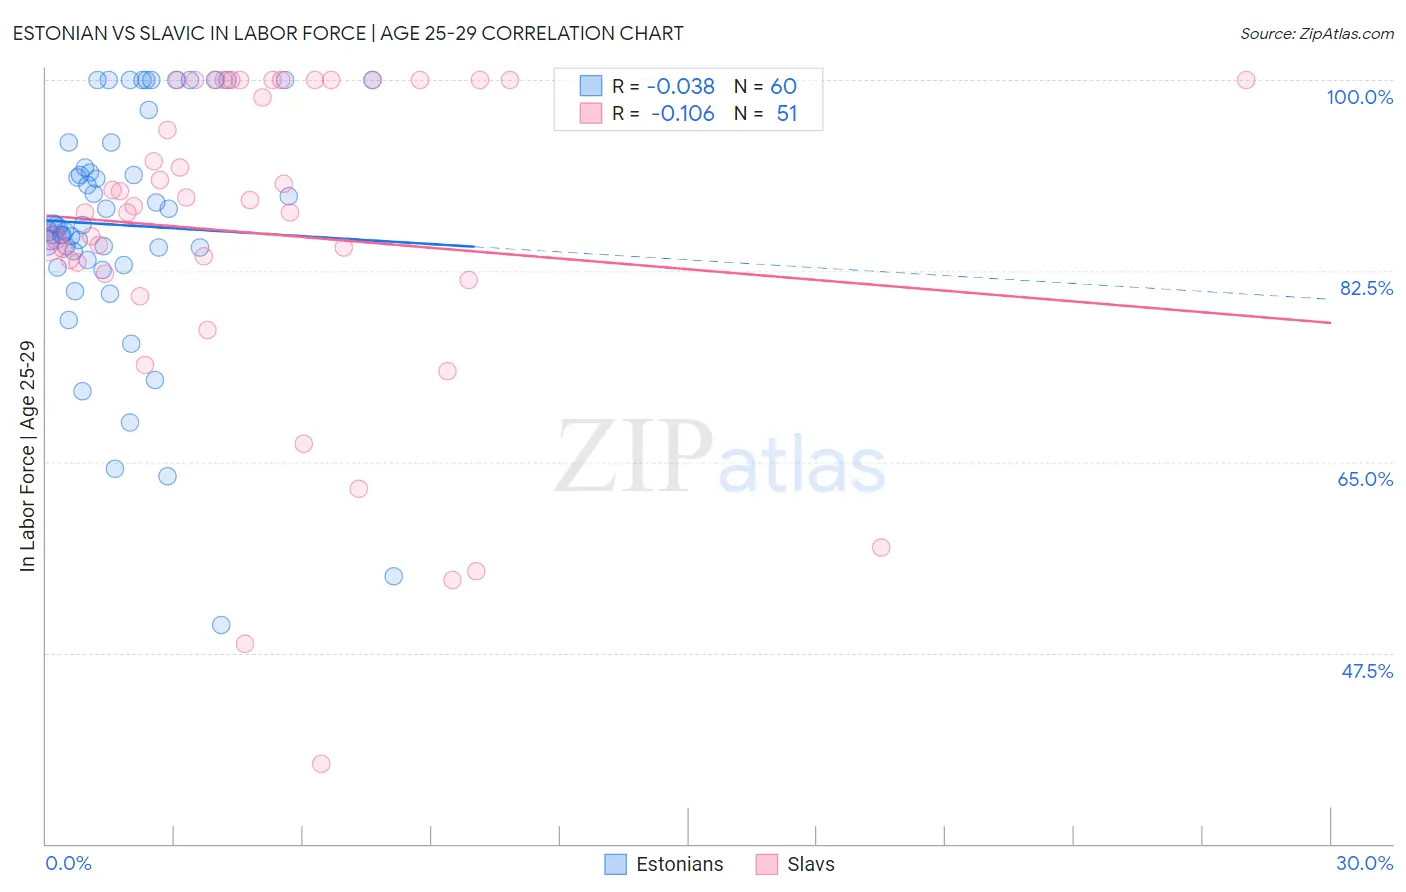
Estonian vs Slavic In Labor Force | Age 25-29 Correlation Chart
The statistical analysis conducted on geographies consisting of 123,516,620 people shows no correlation between the proportion of Estonians and labor force participation rate among population between the ages 25 and 29 in the United States with a correlation coefficient (R) of -0.038 and weighted average of 85.5%. Similarly, the statistical analysis conducted on geographies consisting of 270,808,387 people shows a poor negative correlation between the proportion of Slavs and labor force participation rate among population between the ages 25 and 29 in the United States with a correlation coefficient (R) of -0.106 and weighted average of 85.1%, a difference of 0.50%.
In Labor Force | Age 25-29 Correlation Summary
| Measurement | Estonian | Slavic |
| Minimum | 50.0% | 37.3% |
| Maximum | 100.0% | 100.0% |
| Range | 50.0% | 62.7% |
| Mean | 86.7% | 85.9% |
| Median | 86.6% | 88.4% |
| Interquartile 25% (IQ1) | 83.9% | 82.3% |
| Interquartile 75% (IQ3) | 93.1% | 100.0% |
| Interquartile Range (IQR) | 9.2% | 17.7% |
| Standard Deviation (Sample) | 10.9% | 15.1% |
| Standard Deviation (Population) | 10.8% | 14.9% |
Similar Demographics by In Labor Force | Age 25-29
Demographics Similar to Estonians by In Labor Force | Age 25-29
In terms of in labor force | age 25-29, the demographic groups most similar to Estonians are Eastern European (85.5%, a difference of 0.010%), Greek (85.5%, a difference of 0.010%), Immigrants from Morocco (85.5%, a difference of 0.010%), Immigrants from Brazil (85.5%, a difference of 0.040%), and Thai (85.5%, a difference of 0.040%).
| Demographics | Rating | Rank | In Labor Force | Age 25-29 |
| Yugoslavians | 99.8 /100 | #50 | Exceptional 85.6% |
| Immigrants | Latvia | 99.8 /100 | #51 | Exceptional 85.6% |
| Immigrants | Poland | 99.7 /100 | #52 | Exceptional 85.6% |
| Belgians | 99.7 /100 | #53 | Exceptional 85.5% |
| Albanians | 99.7 /100 | #54 | Exceptional 85.5% |
| Immigrants | Brazil | 99.7 /100 | #55 | Exceptional 85.5% |
| Eastern Europeans | 99.6 /100 | #56 | Exceptional 85.5% |
| Estonians | 99.6 /100 | #57 | Exceptional 85.5% |
| Greeks | 99.6 /100 | #58 | Exceptional 85.5% |
| Immigrants | Morocco | 99.5 /100 | #59 | Exceptional 85.5% |
| Thais | 99.5 /100 | #60 | Exceptional 85.5% |
| Serbians | 99.5 /100 | #61 | Exceptional 85.5% |
| Taiwanese | 99.4 /100 | #62 | Exceptional 85.4% |
| Immigrants | Kenya | 99.4 /100 | #63 | Exceptional 85.4% |
| Immigrants | Italy | 99.3 /100 | #64 | Exceptional 85.4% |
Demographics Similar to Slavs by In Labor Force | Age 25-29
In terms of in labor force | age 25-29, the demographic groups most similar to Slavs are Egyptian (85.1%, a difference of 0.0%), Mongolian (85.1%, a difference of 0.010%), Bangladeshi (85.1%, a difference of 0.010%), Immigrants from Switzerland (85.1%, a difference of 0.010%), and Immigrants from Japan (85.1%, a difference of 0.010%).
| Demographics | Rating | Rank | In Labor Force | Age 25-29 |
| Immigrants | Netherlands | 94.6 /100 | #95 | Exceptional 85.1% |
| Immigrants | Romania | 94.6 /100 | #96 | Exceptional 85.1% |
| Immigrants | Sudan | 94.3 /100 | #97 | Exceptional 85.1% |
| Mongolians | 94.1 /100 | #98 | Exceptional 85.1% |
| Bangladeshis | 94.0 /100 | #99 | Exceptional 85.1% |
| Immigrants | Switzerland | 93.9 /100 | #100 | Exceptional 85.1% |
| Egyptians | 93.8 /100 | #101 | Exceptional 85.1% |
| Slavs | 93.7 /100 | #102 | Exceptional 85.1% |
| Immigrants | Japan | 93.5 /100 | #103 | Exceptional 85.1% |
| Immigrants | Zaire | 93.3 /100 | #104 | Exceptional 85.1% |
| Immigrants | Hong Kong | 92.8 /100 | #105 | Exceptional 85.0% |
| Czechoslovakians | 92.6 /100 | #106 | Exceptional 85.0% |
| Immigrants | Southern Europe | 92.3 /100 | #107 | Exceptional 85.0% |
| Immigrants | Austria | 91.9 /100 | #108 | Exceptional 85.0% |
| Costa Ricans | 91.9 /100 | #109 | Exceptional 85.0% |