Cypriot vs Hungarian In Labor Force | Age 25-29
COMPARE
Cypriot
Hungarian
In Labor Force | Age 25-29
In Labor Force | Age 25-29 Comparison
Cypriots
Hungarians
85.8%
IN LABOR FORCE | AGE 25-29
99.9/ 100
METRIC RATING
35th/ 347
METRIC RANK
84.6%
IN LABOR FORCE | AGE 25-29
47.8/ 100
METRIC RATING
175th/ 347
METRIC RANK
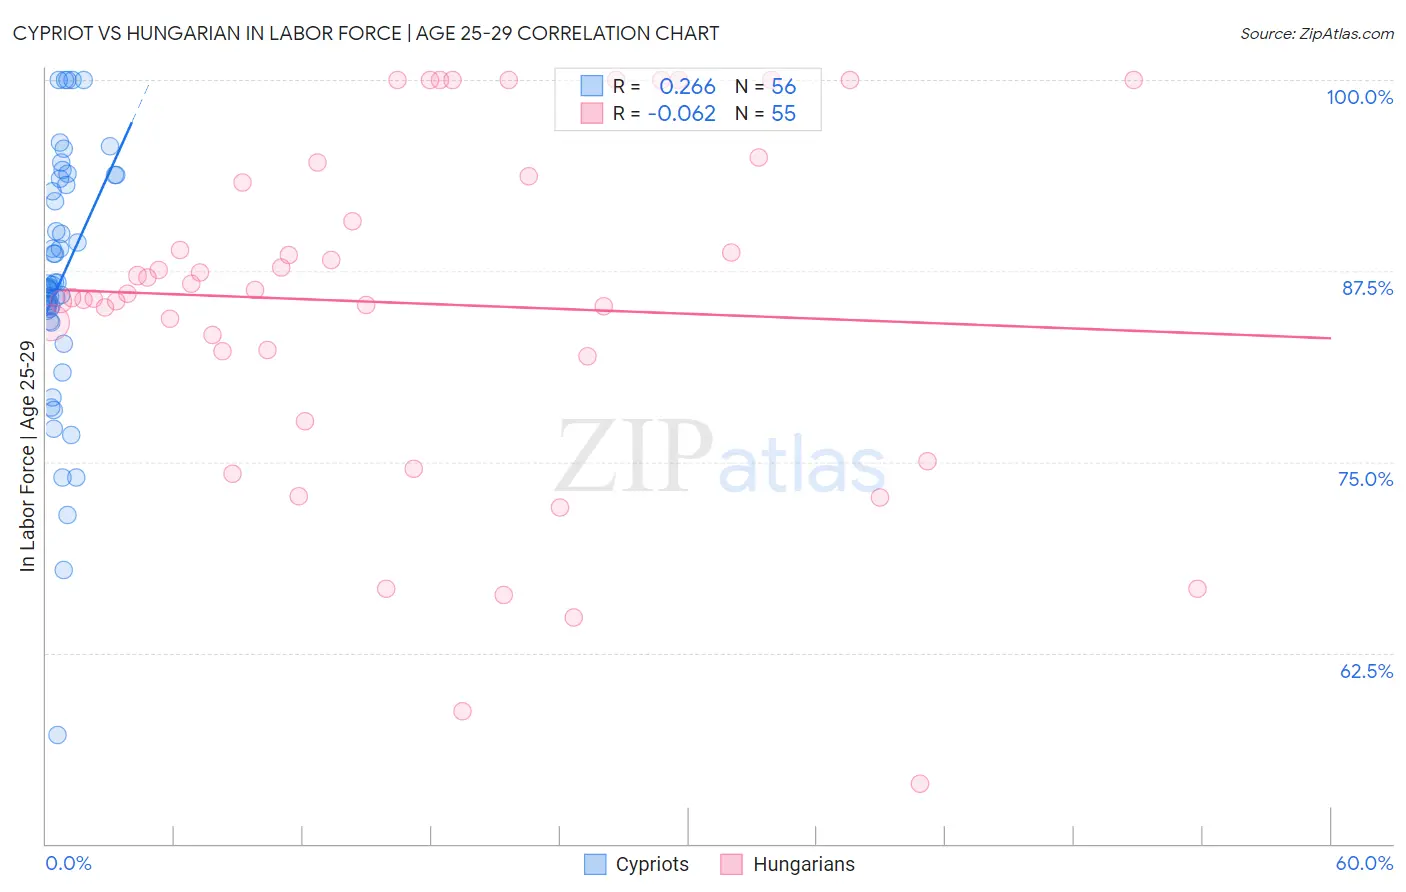
Cypriot vs Hungarian In Labor Force | Age 25-29 Correlation Chart
The statistical analysis conducted on geographies consisting of 61,853,224 people shows a weak positive correlation between the proportion of Cypriots and labor force participation rate among population between the ages 25 and 29 in the United States with a correlation coefficient (R) of 0.266 and weighted average of 85.8%. Similarly, the statistical analysis conducted on geographies consisting of 485,787,626 people shows a slight negative correlation between the proportion of Hungarians and labor force participation rate among population between the ages 25 and 29 in the United States with a correlation coefficient (R) of -0.062 and weighted average of 84.6%, a difference of 1.4%.
In Labor Force | Age 25-29 Correlation Summary
| Measurement | Cypriot | Hungarian |
| Minimum | 57.1% | 53.9% |
| Maximum | 100.0% | 100.0% |
| Range | 42.9% | 46.1% |
| Mean | 86.9% | 85.4% |
| Median | 86.5% | 86.0% |
| Interquartile 25% (IQ1) | 84.6% | 81.9% |
| Interquartile 75% (IQ3) | 93.3% | 93.7% |
| Interquartile Range (IQR) | 8.7% | 11.8% |
| Standard Deviation (Sample) | 8.4% | 11.3% |
| Standard Deviation (Population) | 8.3% | 11.2% |
Similar Demographics by In Labor Force | Age 25-29
Demographics Similar to Cypriots by In Labor Force | Age 25-29
In terms of in labor force | age 25-29, the demographic groups most similar to Cypriots are Immigrants from Nepal (85.8%, a difference of 0.0%), Lithuanian (85.8%, a difference of 0.010%), Polish (85.8%, a difference of 0.030%), German Russian (85.8%, a difference of 0.040%), and Slovak (85.8%, a difference of 0.040%).
| Demographics | Rating | Rank | In Labor Force | Age 25-29 |
| Ugandans | 100.0 /100 | #28 | Exceptional 85.9% |
| Immigrants | Liberia | 100.0 /100 | #29 | Exceptional 85.9% |
| Immigrants | Serbia | 100.0 /100 | #30 | Exceptional 85.9% |
| German Russians | 100.0 /100 | #31 | Exceptional 85.8% |
| Slovaks | 100.0 /100 | #32 | Exceptional 85.8% |
| Immigrants | Bulgaria | 100.0 /100 | #33 | Exceptional 85.8% |
| Lithuanians | 99.9 /100 | #34 | Exceptional 85.8% |
| Cypriots | 99.9 /100 | #35 | Exceptional 85.8% |
| Immigrants | Nepal | 99.9 /100 | #36 | Exceptional 85.8% |
| Poles | 99.9 /100 | #37 | Exceptional 85.8% |
| Sierra Leoneans | 99.9 /100 | #38 | Exceptional 85.8% |
| Croatians | 99.9 /100 | #39 | Exceptional 85.8% |
| Immigrants | Albania | 99.9 /100 | #40 | Exceptional 85.7% |
| Immigrants | Greece | 99.9 /100 | #41 | Exceptional 85.7% |
| Immigrants | Eritrea | 99.9 /100 | #42 | Exceptional 85.7% |
Demographics Similar to Hungarians by In Labor Force | Age 25-29
In terms of in labor force | age 25-29, the demographic groups most similar to Hungarians are Malaysian (84.6%, a difference of 0.010%), Immigrants from Vietnam (84.7%, a difference of 0.020%), Immigrants from Western Europe (84.7%, a difference of 0.020%), Assyrian/Chaldean/Syriac (84.7%, a difference of 0.020%), and Palestinian (84.7%, a difference of 0.020%).
| Demographics | Rating | Rank | In Labor Force | Age 25-29 |
| South Americans | 54.9 /100 | #168 | Average 84.7% |
| Celtics | 52.5 /100 | #169 | Average 84.7% |
| Tongans | 52.4 /100 | #170 | Average 84.7% |
| Immigrants | Vietnam | 50.5 /100 | #171 | Average 84.7% |
| Immigrants | Western Europe | 50.4 /100 | #172 | Average 84.7% |
| Assyrians/Chaldeans/Syriacs | 50.2 /100 | #173 | Average 84.7% |
| Palestinians | 50.0 /100 | #174 | Average 84.7% |
| Hungarians | 47.8 /100 | #175 | Average 84.6% |
| Malaysians | 46.8 /100 | #176 | Average 84.6% |
| Immigrants | China | 45.7 /100 | #177 | Average 84.6% |
| Immigrants | Thailand | 45.2 /100 | #178 | Average 84.6% |
| Immigrants | Argentina | 44.0 /100 | #179 | Average 84.6% |
| Immigrants | South America | 42.9 /100 | #180 | Average 84.6% |
| Immigrants | Norway | 41.9 /100 | #181 | Average 84.6% |
| Europeans | 40.3 /100 | #182 | Average 84.6% |