Estonian vs Lumbee In Labor Force | Age 25-29
COMPARE
Estonian
Lumbee
In Labor Force | Age 25-29
In Labor Force | Age 25-29 Comparison
Estonians
Lumbee
85.5%
IN LABOR FORCE | AGE 25-29
99.6/ 100
METRIC RATING
57th/ 347
METRIC RANK
78.3%
IN LABOR FORCE | AGE 25-29
0.0/ 100
METRIC RATING
338th/ 347
METRIC RANK
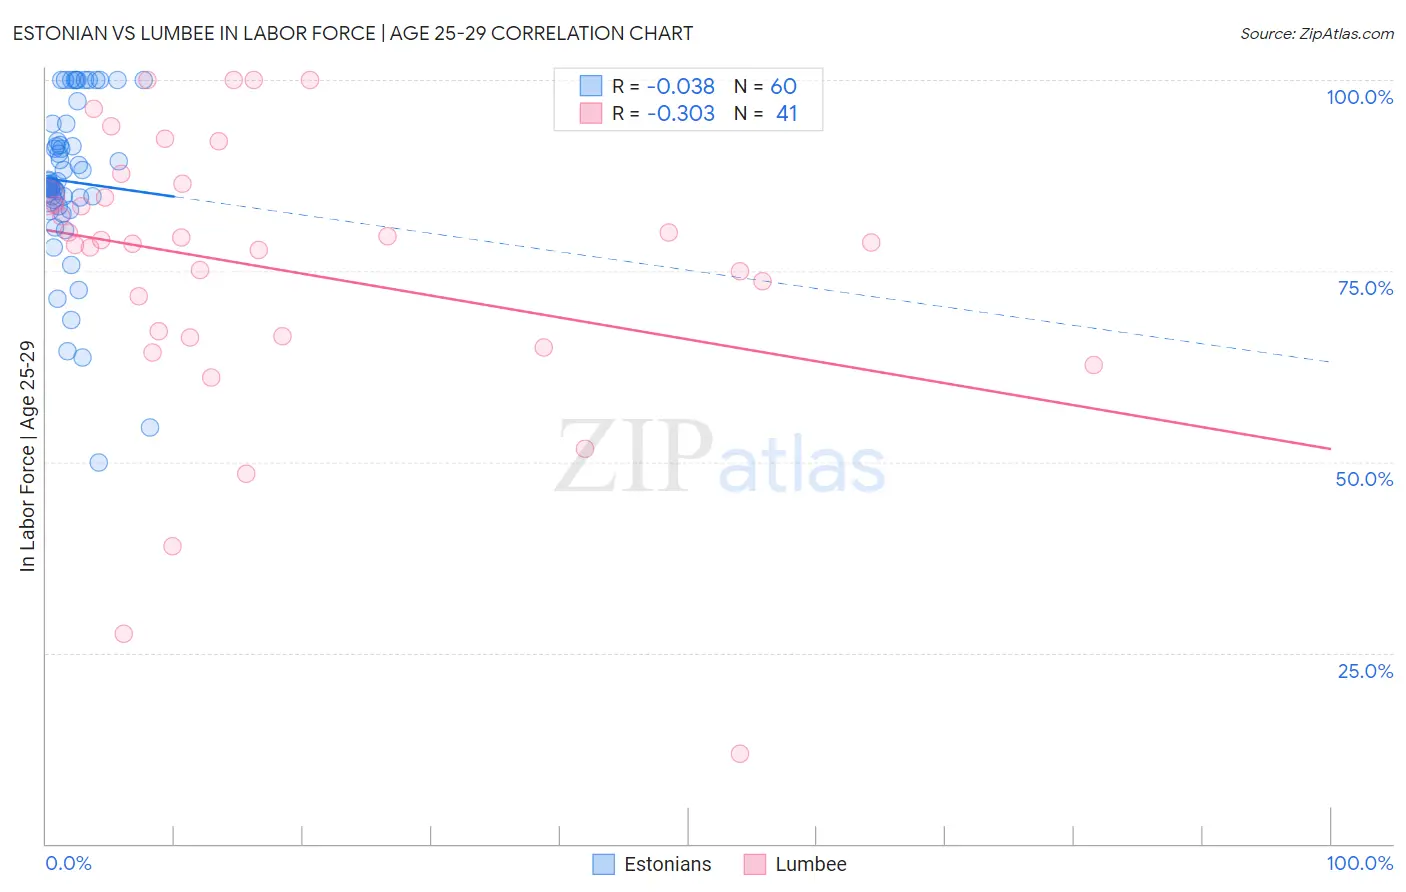
Estonian vs Lumbee In Labor Force | Age 25-29 Correlation Chart
The statistical analysis conducted on geographies consisting of 123,516,620 people shows no correlation between the proportion of Estonians and labor force participation rate among population between the ages 25 and 29 in the United States with a correlation coefficient (R) of -0.038 and weighted average of 85.5%. Similarly, the statistical analysis conducted on geographies consisting of 92,283,478 people shows a mild negative correlation between the proportion of Lumbee and labor force participation rate among population between the ages 25 and 29 in the United States with a correlation coefficient (R) of -0.303 and weighted average of 78.3%, a difference of 9.2%.
In Labor Force | Age 25-29 Correlation Summary
| Measurement | Estonian | Lumbee |
| Minimum | 50.0% | 11.8% |
| Maximum | 100.0% | 100.0% |
| Range | 50.0% | 88.2% |
| Mean | 86.7% | 75.2% |
| Median | 86.6% | 78.7% |
| Interquartile 25% (IQ1) | 83.9% | 66.3% |
| Interquartile 75% (IQ3) | 93.1% | 85.5% |
| Interquartile Range (IQR) | 9.2% | 19.2% |
| Standard Deviation (Sample) | 10.9% | 18.9% |
| Standard Deviation (Population) | 10.8% | 18.7% |
Similar Demographics by In Labor Force | Age 25-29
Demographics Similar to Estonians by In Labor Force | Age 25-29
In terms of in labor force | age 25-29, the demographic groups most similar to Estonians are Eastern European (85.5%, a difference of 0.010%), Greek (85.5%, a difference of 0.010%), Immigrants from Morocco (85.5%, a difference of 0.010%), Immigrants from Brazil (85.5%, a difference of 0.040%), and Thai (85.5%, a difference of 0.040%).
| Demographics | Rating | Rank | In Labor Force | Age 25-29 |
| Yugoslavians | 99.8 /100 | #50 | Exceptional 85.6% |
| Immigrants | Latvia | 99.8 /100 | #51 | Exceptional 85.6% |
| Immigrants | Poland | 99.7 /100 | #52 | Exceptional 85.6% |
| Belgians | 99.7 /100 | #53 | Exceptional 85.5% |
| Albanians | 99.7 /100 | #54 | Exceptional 85.5% |
| Immigrants | Brazil | 99.7 /100 | #55 | Exceptional 85.5% |
| Eastern Europeans | 99.6 /100 | #56 | Exceptional 85.5% |
| Estonians | 99.6 /100 | #57 | Exceptional 85.5% |
| Greeks | 99.6 /100 | #58 | Exceptional 85.5% |
| Immigrants | Morocco | 99.5 /100 | #59 | Exceptional 85.5% |
| Thais | 99.5 /100 | #60 | Exceptional 85.5% |
| Serbians | 99.5 /100 | #61 | Exceptional 85.5% |
| Taiwanese | 99.4 /100 | #62 | Exceptional 85.4% |
| Immigrants | Kenya | 99.4 /100 | #63 | Exceptional 85.4% |
| Immigrants | Italy | 99.3 /100 | #64 | Exceptional 85.4% |
Demographics Similar to Lumbee by In Labor Force | Age 25-29
In terms of in labor force | age 25-29, the demographic groups most similar to Lumbee are Immigrants from Yemen (78.2%, a difference of 0.12%), Paiute (78.1%, a difference of 0.28%), Crow (78.6%, a difference of 0.37%), Tohono O'odham (77.5%, a difference of 1.1%), and Pueblo (77.5%, a difference of 1.1%).
| Demographics | Rating | Rank | In Labor Force | Age 25-29 |
| Cheyenne | 0.0 /100 | #331 | Tragic 80.3% |
| Inupiat | 0.0 /100 | #332 | Tragic 79.8% |
| Sioux | 0.0 /100 | #333 | Tragic 79.7% |
| Yuman | 0.0 /100 | #334 | Tragic 79.3% |
| Natives/Alaskans | 0.0 /100 | #335 | Tragic 79.3% |
| Apache | 0.0 /100 | #336 | Tragic 79.2% |
| Crow | 0.0 /100 | #337 | Tragic 78.6% |
| Lumbee | 0.0 /100 | #338 | Tragic 78.3% |
| Immigrants | Yemen | 0.0 /100 | #339 | Tragic 78.2% |
| Paiute | 0.0 /100 | #340 | Tragic 78.1% |
| Tohono O'odham | 0.0 /100 | #341 | Tragic 77.5% |
| Pueblo | 0.0 /100 | #342 | Tragic 77.5% |
| Arapaho | 0.0 /100 | #343 | Tragic 76.6% |
| Hopi | 0.0 /100 | #344 | Tragic 76.5% |
| Navajo | 0.0 /100 | #345 | Tragic 74.6% |