Immigrants from Iraq vs Hungarian In Labor Force | Age 25-29
COMPARE
Immigrants from Iraq
Hungarian
In Labor Force | Age 25-29
In Labor Force | Age 25-29 Comparison
Immigrants from Iraq
Hungarians
84.4%
IN LABOR FORCE | AGE 25-29
19.0/ 100
METRIC RATING
198th/ 347
METRIC RANK
84.6%
IN LABOR FORCE | AGE 25-29
47.8/ 100
METRIC RATING
175th/ 347
METRIC RANK
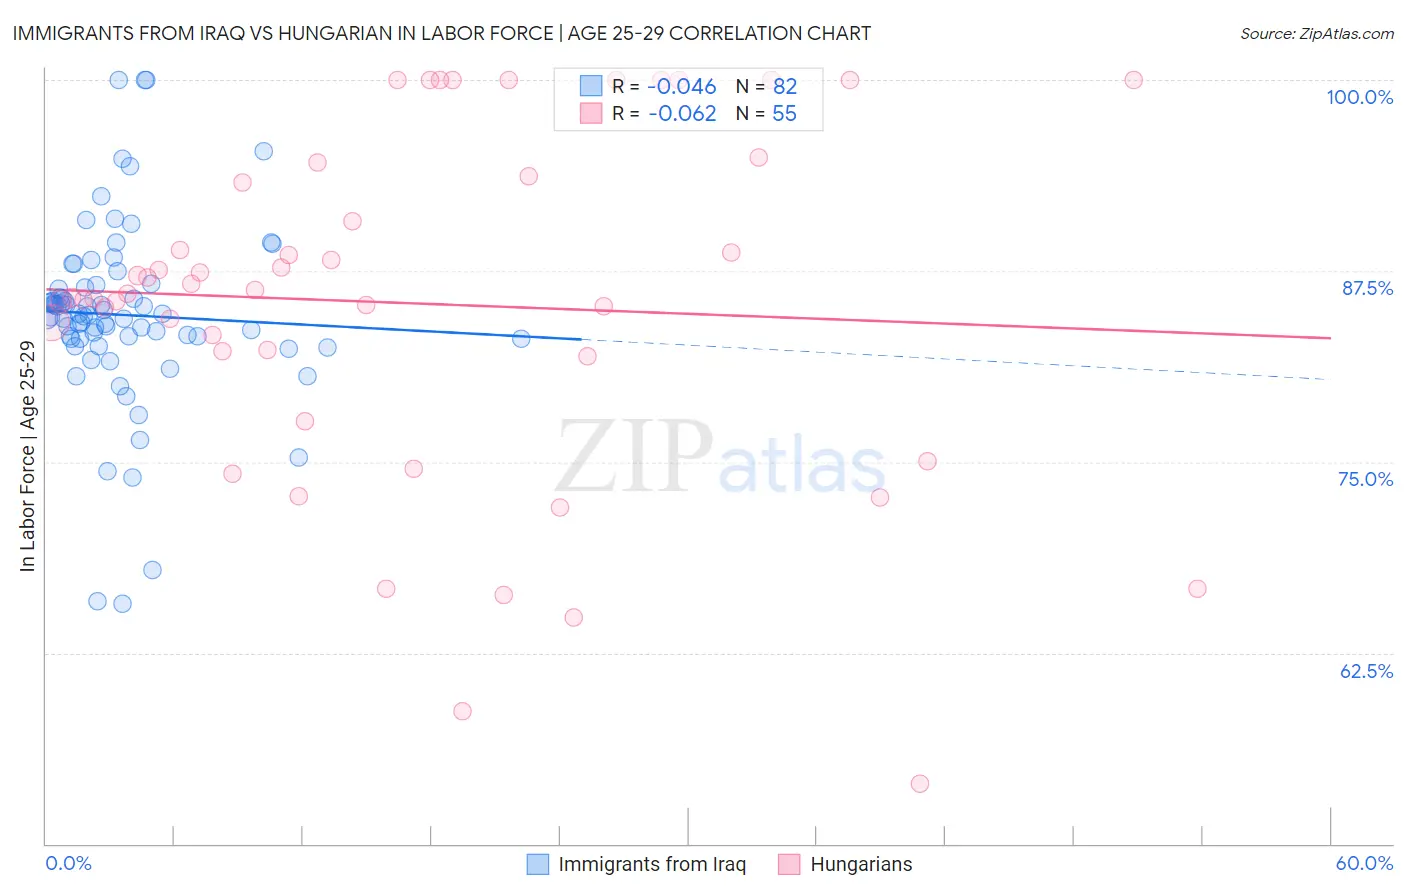
Immigrants from Iraq vs Hungarian In Labor Force | Age 25-29 Correlation Chart
The statistical analysis conducted on geographies consisting of 194,759,313 people shows no correlation between the proportion of Immigrants from Iraq and labor force participation rate among population between the ages 25 and 29 in the United States with a correlation coefficient (R) of -0.046 and weighted average of 84.4%. Similarly, the statistical analysis conducted on geographies consisting of 485,787,626 people shows a slight negative correlation between the proportion of Hungarians and labor force participation rate among population between the ages 25 and 29 in the United States with a correlation coefficient (R) of -0.062 and weighted average of 84.6%, a difference of 0.25%.
In Labor Force | Age 25-29 Correlation Summary
| Measurement | Immigrants from Iraq | Hungarian |
| Minimum | 65.7% | 53.9% |
| Maximum | 100.0% | 100.0% |
| Range | 34.3% | 46.1% |
| Mean | 84.6% | 85.4% |
| Median | 84.6% | 86.0% |
| Interquartile 25% (IQ1) | 83.0% | 81.9% |
| Interquartile 75% (IQ3) | 86.4% | 93.7% |
| Interquartile Range (IQR) | 3.4% | 11.8% |
| Standard Deviation (Sample) | 6.0% | 11.3% |
| Standard Deviation (Population) | 5.9% | 11.2% |
Similar Demographics by In Labor Force | Age 25-29
Demographics Similar to Immigrants from Iraq by In Labor Force | Age 25-29
In terms of in labor force | age 25-29, the demographic groups most similar to Immigrants from Iraq are Tlingit-Haida (84.4%, a difference of 0.0%), Immigrants from South Eastern Asia (84.4%, a difference of 0.010%), Immigrants from Germany (84.4%, a difference of 0.010%), Immigrants from Israel (84.4%, a difference of 0.020%), and Immigrants from Kazakhstan (84.4%, a difference of 0.020%).
| Demographics | Rating | Rank | In Labor Force | Age 25-29 |
| Zimbabweans | 28.7 /100 | #191 | Fair 84.5% |
| English | 25.8 /100 | #192 | Fair 84.5% |
| South American Indians | 25.0 /100 | #193 | Fair 84.5% |
| Portuguese | 21.2 /100 | #194 | Fair 84.4% |
| Immigrants | Israel | 20.8 /100 | #195 | Fair 84.4% |
| Immigrants | South Eastern Asia | 19.5 /100 | #196 | Poor 84.4% |
| Tlingit-Haida | 19.3 /100 | #197 | Poor 84.4% |
| Immigrants | Iraq | 19.0 /100 | #198 | Poor 84.4% |
| Immigrants | Germany | 18.3 /100 | #199 | Poor 84.4% |
| Immigrants | Kazakhstan | 17.5 /100 | #200 | Poor 84.4% |
| Laotians | 16.6 /100 | #201 | Poor 84.4% |
| Afghans | 15.9 /100 | #202 | Poor 84.4% |
| Immigrants | Afghanistan | 15.6 /100 | #203 | Poor 84.4% |
| Venezuelans | 15.1 /100 | #204 | Poor 84.4% |
| Ecuadorians | 14.8 /100 | #205 | Poor 84.4% |
Demographics Similar to Hungarians by In Labor Force | Age 25-29
In terms of in labor force | age 25-29, the demographic groups most similar to Hungarians are Malaysian (84.6%, a difference of 0.010%), Immigrants from Vietnam (84.7%, a difference of 0.020%), Immigrants from Western Europe (84.7%, a difference of 0.020%), Assyrian/Chaldean/Syriac (84.7%, a difference of 0.020%), and Palestinian (84.7%, a difference of 0.020%).
| Demographics | Rating | Rank | In Labor Force | Age 25-29 |
| South Americans | 54.9 /100 | #168 | Average 84.7% |
| Celtics | 52.5 /100 | #169 | Average 84.7% |
| Tongans | 52.4 /100 | #170 | Average 84.7% |
| Immigrants | Vietnam | 50.5 /100 | #171 | Average 84.7% |
| Immigrants | Western Europe | 50.4 /100 | #172 | Average 84.7% |
| Assyrians/Chaldeans/Syriacs | 50.2 /100 | #173 | Average 84.7% |
| Palestinians | 50.0 /100 | #174 | Average 84.7% |
| Hungarians | 47.8 /100 | #175 | Average 84.6% |
| Malaysians | 46.8 /100 | #176 | Average 84.6% |
| Immigrants | China | 45.7 /100 | #177 | Average 84.6% |
| Immigrants | Thailand | 45.2 /100 | #178 | Average 84.6% |
| Immigrants | Argentina | 44.0 /100 | #179 | Average 84.6% |
| Immigrants | South America | 42.9 /100 | #180 | Average 84.6% |
| Immigrants | Norway | 41.9 /100 | #181 | Average 84.6% |
| Europeans | 40.3 /100 | #182 | Average 84.6% |