Immigrants from Hungary vs Cambodian In Labor Force | Age > 16
COMPARE
Immigrants from Hungary
Cambodian
In Labor Force | Age > 16
In Labor Force | Age > 16 Comparison
Immigrants from Hungary
Cambodians
64.5%
IN LABOR FORCE | AGE > 16
3.8/ 100
METRIC RATING
239th/ 347
METRIC RANK
67.4%
IN LABOR FORCE | AGE > 16
100.0/ 100
METRIC RATING
23rd/ 347
METRIC RANK
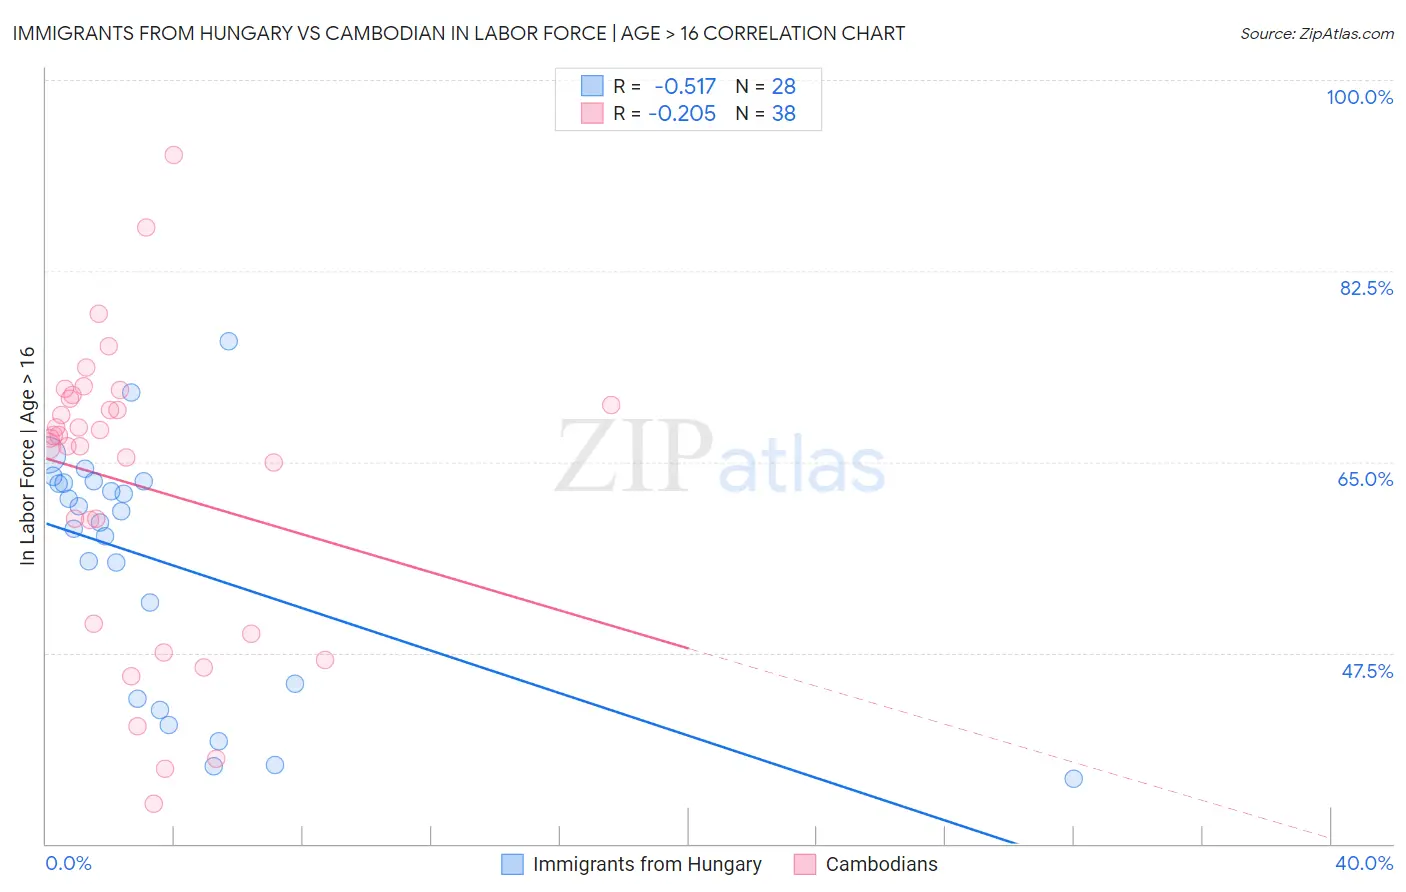
Immigrants from Hungary vs Cambodian In Labor Force | Age > 16 Correlation Chart
The statistical analysis conducted on geographies consisting of 195,708,395 people shows a substantial negative correlation between the proportion of Immigrants from Hungary and labor force participation rate among population ages 16 and over in the United States with a correlation coefficient (R) of -0.517 and weighted average of 64.5%. Similarly, the statistical analysis conducted on geographies consisting of 102,521,417 people shows a weak negative correlation between the proportion of Cambodians and labor force participation rate among population ages 16 and over in the United States with a correlation coefficient (R) of -0.205 and weighted average of 67.4%, a difference of 4.5%.
In Labor Force | Age > 16 Correlation Summary
| Measurement | Immigrants from Hungary | Cambodian |
| Minimum | 36.0% | 33.7% |
| Maximum | 76.0% | 93.1% |
| Range | 40.0% | 59.4% |
| Mean | 55.8% | 63.0% |
| Median | 60.0% | 67.3% |
| Interquartile 25% (IQ1) | 44.0% | 50.2% |
| Interquartile 75% (IQ3) | 63.1% | 70.8% |
| Interquartile Range (IQR) | 19.1% | 20.6% |
| Standard Deviation (Sample) | 11.1% | 13.6% |
| Standard Deviation (Population) | 10.9% | 13.4% |
Similar Demographics by In Labor Force | Age > 16
Demographics Similar to Immigrants from Hungary by In Labor Force | Age > 16
In terms of in labor force | age > 16, the demographic groups most similar to Immigrants from Hungary are Lebanese (64.5%, a difference of 0.010%), Immigrants from Bangladesh (64.5%, a difference of 0.020%), Immigrants from Dominica (64.5%, a difference of 0.020%), Immigrants from Netherlands (64.5%, a difference of 0.030%), and Immigrants from Lebanon (64.5%, a difference of 0.050%).
| Demographics | Rating | Rank | In Labor Force | Age > 16 |
| Africans | 5.8 /100 | #232 | Tragic 64.6% |
| Slavs | 4.9 /100 | #233 | Tragic 64.6% |
| Vietnamese | 4.7 /100 | #234 | Tragic 64.6% |
| Austrians | 4.6 /100 | #235 | Tragic 64.6% |
| Immigrants | Norway | 4.6 /100 | #236 | Tragic 64.6% |
| Italians | 4.6 /100 | #237 | Tragic 64.6% |
| Lebanese | 3.9 /100 | #238 | Tragic 64.5% |
| Immigrants | Hungary | 3.8 /100 | #239 | Tragic 64.5% |
| Immigrants | Bangladesh | 3.6 /100 | #240 | Tragic 64.5% |
| Immigrants | Dominica | 3.5 /100 | #241 | Tragic 64.5% |
| Immigrants | Netherlands | 3.4 /100 | #242 | Tragic 64.5% |
| Immigrants | Lebanon | 3.2 /100 | #243 | Tragic 64.5% |
| Tsimshian | 3.1 /100 | #244 | Tragic 64.5% |
| West Indians | 3.0 /100 | #245 | Tragic 64.5% |
| Immigrants | Caribbean | 2.3 /100 | #246 | Tragic 64.4% |
Demographics Similar to Cambodians by In Labor Force | Age > 16
In terms of in labor force | age > 16, the demographic groups most similar to Cambodians are Ugandan (67.4%, a difference of 0.060%), Immigrants from Africa (67.4%, a difference of 0.090%), Immigrants from Uganda (67.5%, a difference of 0.12%), Immigrants from Cabo Verde (67.3%, a difference of 0.12%), and Tongan (67.5%, a difference of 0.18%).
| Demographics | Rating | Rank | In Labor Force | Age > 16 |
| Immigrants | Sudan | 100.0 /100 | #16 | Exceptional 67.7% |
| Immigrants | India | 100.0 /100 | #17 | Exceptional 67.6% |
| Immigrants | Liberia | 100.0 /100 | #18 | Exceptional 67.6% |
| Kenyans | 100.0 /100 | #19 | Exceptional 67.6% |
| Immigrants | Kenya | 100.0 /100 | #20 | Exceptional 67.6% |
| Tongans | 100.0 /100 | #21 | Exceptional 67.5% |
| Immigrants | Uganda | 100.0 /100 | #22 | Exceptional 67.5% |
| Cambodians | 100.0 /100 | #23 | Exceptional 67.4% |
| Ugandans | 100.0 /100 | #24 | Exceptional 67.4% |
| Immigrants | Africa | 100.0 /100 | #25 | Exceptional 67.4% |
| Immigrants | Cabo Verde | 100.0 /100 | #26 | Exceptional 67.3% |
| Zimbabweans | 100.0 /100 | #27 | Exceptional 67.3% |
| Immigrants | Morocco | 100.0 /100 | #28 | Exceptional 67.2% |
| Thais | 100.0 /100 | #29 | Exceptional 67.2% |
| Immigrants | Zaire | 100.0 /100 | #30 | Exceptional 67.2% |