Immigrants from Europe vs Immigrants from Taiwan In Labor Force | Age > 16
COMPARE
Immigrants from Europe
Immigrants from Taiwan
In Labor Force | Age > 16
In Labor Force | Age > 16 Comparison
Immigrants from Europe
Immigrants from Taiwan
65.0%
IN LABOR FORCE | AGE > 16
33.6/ 100
METRIC RATING
193rd/ 347
METRIC RANK
65.5%
IN LABOR FORCE | AGE > 16
90.8/ 100
METRIC RATING
139th/ 347
METRIC RANK
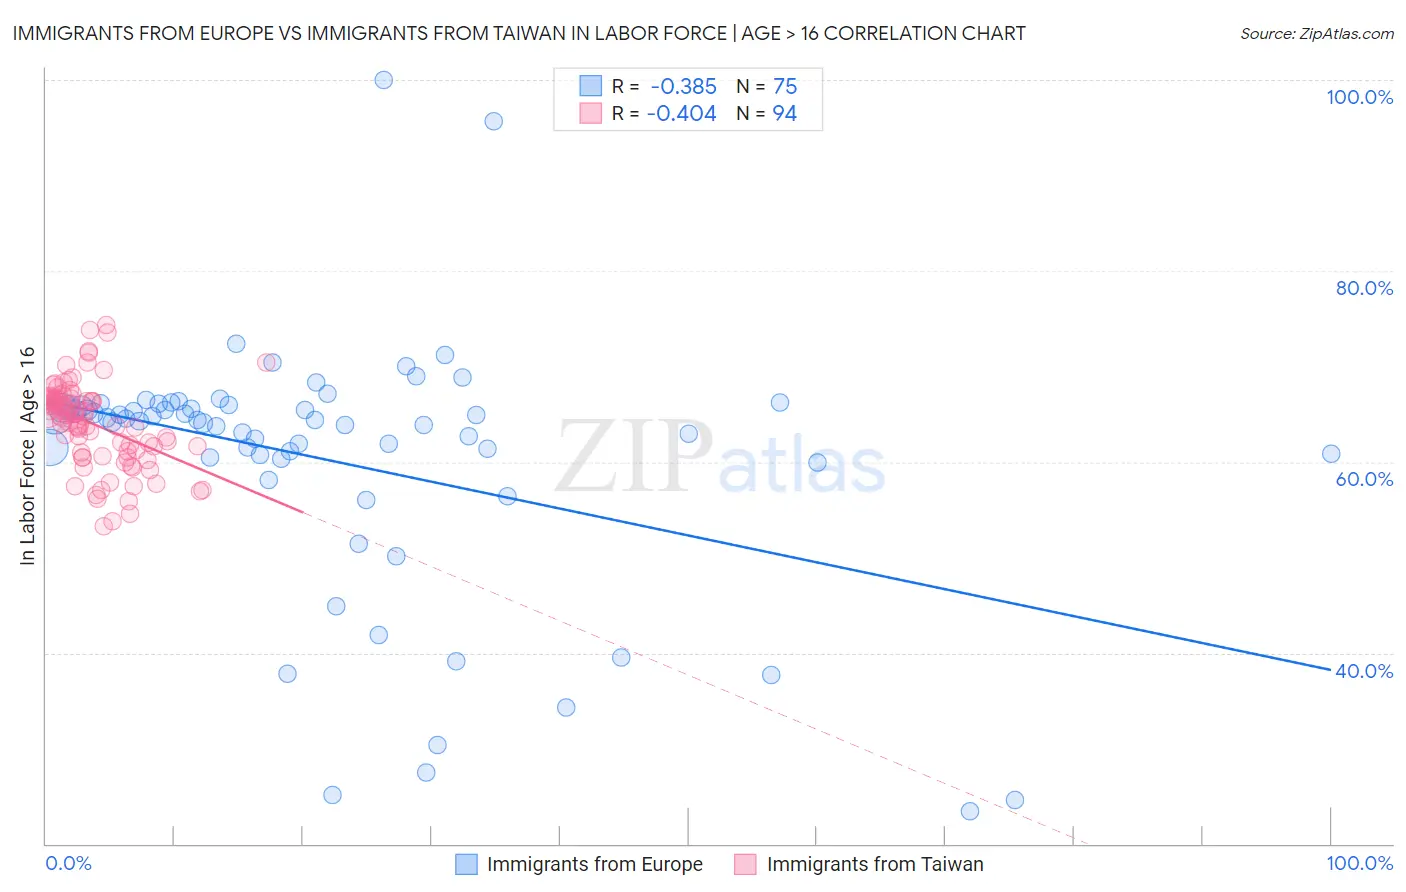
Immigrants from Europe vs Immigrants from Taiwan In Labor Force | Age > 16 Correlation Chart
The statistical analysis conducted on geographies consisting of 547,430,773 people shows a mild negative correlation between the proportion of Immigrants from Europe and labor force participation rate among population ages 16 and over in the United States with a correlation coefficient (R) of -0.385 and weighted average of 65.0%. Similarly, the statistical analysis conducted on geographies consisting of 298,260,285 people shows a moderate negative correlation between the proportion of Immigrants from Taiwan and labor force participation rate among population ages 16 and over in the United States with a correlation coefficient (R) of -0.404 and weighted average of 65.5%, a difference of 0.83%.
In Labor Force | Age > 16 Correlation Summary
| Measurement | Immigrants from Europe | Immigrants from Taiwan |
| Minimum | 23.4% | 53.2% |
| Maximum | 100.0% | 74.4% |
| Range | 76.6% | 21.2% |
| Mean | 60.1% | 63.9% |
| Median | 64.3% | 64.8% |
| Interquartile 25% (IQ1) | 60.3% | 61.0% |
| Interquartile 75% (IQ3) | 65.8% | 66.6% |
| Interquartile Range (IQR) | 5.5% | 5.6% |
| Standard Deviation (Sample) | 13.6% | 4.5% |
| Standard Deviation (Population) | 13.5% | 4.4% |
Similar Demographics by In Labor Force | Age > 16
Demographics Similar to Immigrants from Europe by In Labor Force | Age > 16
In terms of in labor force | age > 16, the demographic groups most similar to Immigrants from Europe are Barbadian (65.0%, a difference of 0.0%), Scandinavian (65.0%, a difference of 0.0%), Immigrants from Fiji (65.0%, a difference of 0.0%), Immigrants from Portugal (65.0%, a difference of 0.010%), and Immigrants from Greece (65.0%, a difference of 0.010%).
| Demographics | Rating | Rank | In Labor Force | Age > 16 |
| Immigrants | Switzerland | 38.2 /100 | #186 | Fair 65.0% |
| Immigrants | Croatia | 35.7 /100 | #187 | Fair 65.0% |
| Immigrants | Portugal | 34.8 /100 | #188 | Fair 65.0% |
| Immigrants | Greece | 34.3 /100 | #189 | Fair 65.0% |
| Barbadians | 33.9 /100 | #190 | Fair 65.0% |
| Scandinavians | 33.7 /100 | #191 | Fair 65.0% |
| Immigrants | Fiji | 33.7 /100 | #192 | Fair 65.0% |
| Immigrants | Europe | 33.6 /100 | #193 | Fair 65.0% |
| Immigrants | Southern Europe | 31.3 /100 | #194 | Fair 65.0% |
| Romanians | 31.1 /100 | #195 | Fair 65.0% |
| Haitians | 30.6 /100 | #196 | Fair 65.0% |
| Immigrants | Italy | 28.7 /100 | #197 | Fair 65.0% |
| Greeks | 26.1 /100 | #198 | Fair 64.9% |
| Mexican American Indians | 23.1 /100 | #199 | Fair 64.9% |
| Armenians | 20.2 /100 | #200 | Fair 64.9% |
Demographics Similar to Immigrants from Taiwan by In Labor Force | Age > 16
In terms of in labor force | age > 16, the demographic groups most similar to Immigrants from Taiwan are Immigrants from Costa Rica (65.5%, a difference of 0.0%), Samoan (65.5%, a difference of 0.010%), Immigrants from West Indies (65.6%, a difference of 0.040%), Indian (Asian) (65.5%, a difference of 0.040%), and Latvian (65.5%, a difference of 0.040%).
| Demographics | Rating | Rank | In Labor Force | Age > 16 |
| Immigrants | North Macedonia | 94.1 /100 | #132 | Exceptional 65.6% |
| Immigrants | Lithuania | 93.5 /100 | #133 | Exceptional 65.6% |
| Costa Ricans | 93.2 /100 | #134 | Exceptional 65.6% |
| Guatemalans | 92.5 /100 | #135 | Exceptional 65.6% |
| Immigrants | Argentina | 92.4 /100 | #136 | Exceptional 65.6% |
| Guamanians/Chamorros | 92.4 /100 | #137 | Exceptional 65.6% |
| Immigrants | West Indies | 92.0 /100 | #138 | Exceptional 65.6% |
| Immigrants | Taiwan | 90.8 /100 | #139 | Exceptional 65.5% |
| Immigrants | Costa Rica | 90.8 /100 | #140 | Exceptional 65.5% |
| Samoans | 90.5 /100 | #141 | Exceptional 65.5% |
| Indians (Asian) | 89.5 /100 | #142 | Excellent 65.5% |
| Latvians | 89.4 /100 | #143 | Excellent 65.5% |
| Immigrants | Romania | 88.6 /100 | #144 | Excellent 65.5% |
| Tlingit-Haida | 88.3 /100 | #145 | Excellent 65.5% |
| Cypriots | 88.2 /100 | #146 | Excellent 65.5% |