Indian (Asian) vs Hmong In Labor Force | Age 35-44
COMPARE
Indian (Asian)
Hmong
In Labor Force | Age 35-44
In Labor Force | Age 35-44 Comparison
Indians (Asian)
Hmong
84.8%
IN LABOR FORCE | AGE 35-44
96.1/ 100
METRIC RATING
98th/ 347
METRIC RANK
82.6%
IN LABOR FORCE | AGE 35-44
0.0/ 100
METRIC RATING
297th/ 347
METRIC RANK
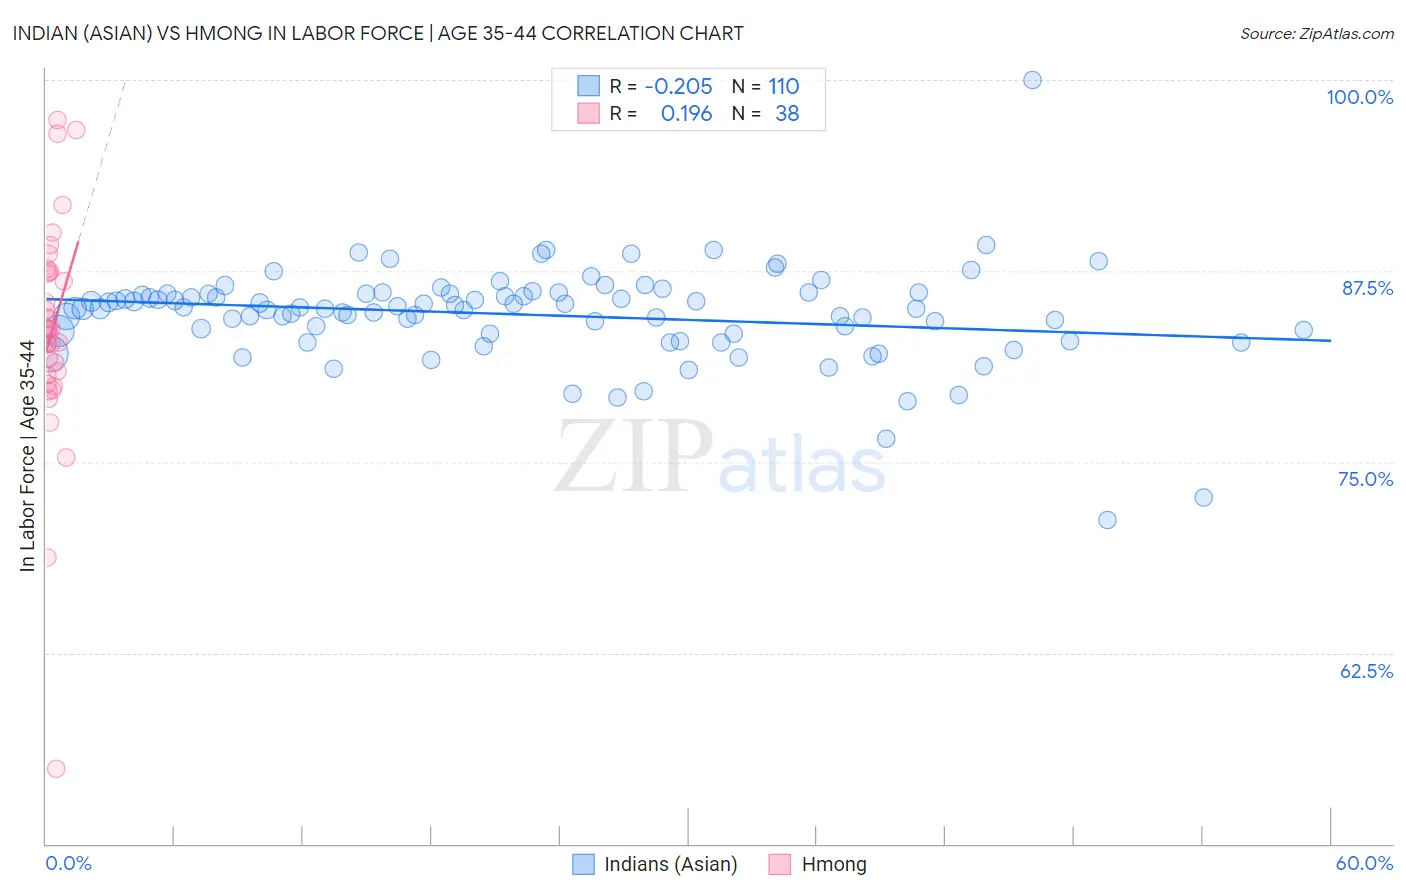
Indian (Asian) vs Hmong In Labor Force | Age 35-44 Correlation Chart
The statistical analysis conducted on geographies consisting of 494,881,837 people shows a weak negative correlation between the proportion of Indians (Asian) and labor force participation rate among population between the ages 35 and 44 in the United States with a correlation coefficient (R) of -0.205 and weighted average of 84.8%. Similarly, the statistical analysis conducted on geographies consisting of 24,669,739 people shows a poor positive correlation between the proportion of Hmong and labor force participation rate among population between the ages 35 and 44 in the United States with a correlation coefficient (R) of 0.196 and weighted average of 82.6%, a difference of 2.7%.
In Labor Force | Age 35-44 Correlation Summary
| Measurement | Indian (Asian) | Hmong |
| Minimum | 71.2% | 54.9% |
| Maximum | 100.0% | 97.4% |
| Range | 28.8% | 42.5% |
| Mean | 84.6% | 83.6% |
| Median | 85.1% | 83.7% |
| Interquartile 25% (IQ1) | 83.4% | 80.7% |
| Interquartile 75% (IQ3) | 86.0% | 87.4% |
| Interquartile Range (IQR) | 2.6% | 6.7% |
| Standard Deviation (Sample) | 3.2% | 7.4% |
| Standard Deviation (Population) | 3.2% | 7.3% |
Similar Demographics by In Labor Force | Age 35-44
Demographics Similar to Indians (Asian) by In Labor Force | Age 35-44
In terms of in labor force | age 35-44, the demographic groups most similar to Indians (Asian) are Haitian (84.8%, a difference of 0.0%), Immigrants from Czechoslovakia (84.8%, a difference of 0.010%), Egyptian (84.8%, a difference of 0.020%), Immigrants from Australia (84.8%, a difference of 0.020%), and Mongolian (84.8%, a difference of 0.030%).
| Demographics | Rating | Rank | In Labor Force | Age 35-44 |
| Immigrants | Europe | 97.2 /100 | #91 | Exceptional 84.9% |
| Ghanaians | 97.2 /100 | #92 | Exceptional 84.8% |
| Immigrants | Northern Africa | 97.1 /100 | #93 | Exceptional 84.8% |
| Mongolians | 96.8 /100 | #94 | Exceptional 84.8% |
| Immigrants | Kuwait | 96.7 /100 | #95 | Exceptional 84.8% |
| Cubans | 96.6 /100 | #96 | Exceptional 84.8% |
| Egyptians | 96.6 /100 | #97 | Exceptional 84.8% |
| Indians (Asian) | 96.1 /100 | #98 | Exceptional 84.8% |
| Haitians | 96.0 /100 | #99 | Exceptional 84.8% |
| Immigrants | Czechoslovakia | 95.9 /100 | #100 | Exceptional 84.8% |
| Immigrants | Australia | 95.5 /100 | #101 | Exceptional 84.8% |
| Immigrants | Southern Europe | 95.3 /100 | #102 | Exceptional 84.8% |
| Immigrants | Belarus | 95.3 /100 | #103 | Exceptional 84.8% |
| Immigrants | Sweden | 95.2 /100 | #104 | Exceptional 84.8% |
| South Americans | 95.0 /100 | #105 | Exceptional 84.8% |
Demographics Similar to Hmong by In Labor Force | Age 35-44
In terms of in labor force | age 35-44, the demographic groups most similar to Hmong are Mexican American Indian (82.6%, a difference of 0.010%), Ottawa (82.6%, a difference of 0.020%), Tlingit-Haida (82.5%, a difference of 0.030%), Central American Indian (82.5%, a difference of 0.090%), and Immigrants from Lebanon (82.7%, a difference of 0.10%).
| Demographics | Rating | Rank | In Labor Force | Age 35-44 |
| Africans | 0.0 /100 | #290 | Tragic 82.9% |
| Pennsylvania Germans | 0.0 /100 | #291 | Tragic 82.9% |
| Immigrants | Latin America | 0.0 /100 | #292 | Tragic 82.8% |
| Spanish Americans | 0.0 /100 | #293 | Tragic 82.8% |
| Potawatomi | 0.0 /100 | #294 | Tragic 82.7% |
| Immigrants | Lebanon | 0.0 /100 | #295 | Tragic 82.7% |
| Mexican American Indians | 0.0 /100 | #296 | Tragic 82.6% |
| Hmong | 0.0 /100 | #297 | Tragic 82.6% |
| Ottawa | 0.0 /100 | #298 | Tragic 82.6% |
| Tlingit-Haida | 0.0 /100 | #299 | Tragic 82.5% |
| Central American Indians | 0.0 /100 | #300 | Tragic 82.5% |
| Spanish American Indians | 0.0 /100 | #301 | Tragic 82.5% |
| Americans | 0.0 /100 | #302 | Tragic 82.4% |
| Nepalese | 0.0 /100 | #303 | Tragic 82.4% |
| Marshallese | 0.0 /100 | #304 | Tragic 82.4% |