Immigrants from Serbia vs Hmong In Labor Force | Age 35-44

COMPARE

Immigrants from Serbia
Race
Ancestry
AfghanAfricanAlaska NativeAlaskan AthabascanAlbanianAleutAlsatianAmericanApacheArabArapahoArgentineanArmenianAssyrian/Chaldean/SyriacAustralianAustrianBahamianBangladeshiBarbadianBasqueBelgianBelizeanBermudanBhutaneseBlackfeetBolivianBrazilianBritishBritish West IndianBulgarianBurmeseCajunCambodianCanadianCape VerdeanCarpatho RusynCelticCentral AmericanCentral American IndianCherokeeCheyenneChickasawChileanChineseChippewaChoctawColombianColvilleComancheCosta RicanCreeCreekCroatianCrowCubanCypriotCzechCzechoslovakianDanishDelawareDominicanDutchDutch West IndianEastern EuropeanEcuadorianEgyptianEnglishEstonianEthiopianEuropeanFijianFilipinoFinnishFrenchFrench American IndianFrench CanadianGermanGerman RussianGhanaianGreekGuamanian/ChamorroGuatemalanGuyaneseHaitianHonduranHopiHoumaHungarianIcelanderIndian (Asian)IndonesianInupiatIranianIraqiIrishIroquoisIsraeliItalianJamaicanJapaneseJordanianKenyanKiowaKoreanLaotianLatvianLebaneseLiberianLithuanianLumbeeLuxembourgerMacedonianMalaysianMalteseMarshalleseMenomineeMexicanMexican American IndianMongolianMoroccanNative HawaiianNavajoNepaleseNew ZealanderNicaraguanNigerianNorthern EuropeanNorwegianOkinawanOsageOttawaPaiutePakistaniPalestinianPanamanianParaguayanPennsylvania GermanPeruvianPimaPolishPortuguesePotawatomiPuebloPuerto RicanPuget Sound SalishRomanianRussianSalvadoranSamoanScandinavianScotch-IrishScottishSeminoleSenegaleseSerbianShoshoneSierra LeoneanSiouxSlavicSlovakSloveneSomaliSouth AfricanSouth AmericanSouth American IndianSoviet UnionSpaniardSpanishSpanish AmericanSpanish American IndianSri LankanSubsaharan AfricanSudaneseSwedishSwissSyrianTaiwaneseThaiTlingit-HaidaTohono O'OdhamTonganTrinidadian and TobagonianTsimshianTurkishU.S. Virgin IslanderUgandanUkrainianUruguayanUteVenezuelanVietnameseWelshWest IndianYakamaYaquiYugoslavianYumanYup'ikZimbabwean
Immigration
NonimmigrantsImmigrantsAfghanistanAfricaAlbaniaArgentinaArmeniaAsiaAustraliaAustriaBahamasBangladeshBarbadosBelarusBelgiumBelizeBoliviaBosnia and HerzegovinaBrazilBulgariaBurma/MyanmarCabo VerdeCambodiaCameroonCanadaCaribbeanCentral AmericaChileChinaColombiaCongoCosta RicaCroatiaCubaCzechoslovakiaDenmarkDominicaDominican RepublicEastern AfricaEastern AsiaEastern EuropeEcuadorEgyptEl SalvadorEnglandEritreaEthiopiaEuropeFijiFranceGermanyGhanaGreeceGrenadaGuatemalaGuyanaHaitiHondurasHong KongHungaryIndiaIndonesiaIranIraqIrelandIsraelItalyJamaicaJapanJordanKazakhstanKenyaKoreaKuwaitLaosLatin AmericaLatviaLebanonLiberiaLithuaniaMalaysiaMexicoMicronesiaMiddle AfricaMoldovaMoroccoNepalNetherlandsNicaraguaNigeriaNorth AmericaNorth MacedoniaNorthern AfricaNorthern EuropeNorwayOceaniaPakistanPanamaPeruPhilippinesPolandPortugalRomaniaRussiaSaudi ArabiaScotlandSenegalSerbiaSierra LeoneSingaporeSomaliaSouth AfricaSouth AmericaSouth Central AsiaSouth Eastern AsiaSouthern EuropeSpainSri LankaSt. Vincent and the GrenadinesSudanSwedenSwitzerlandSyriaTaiwanThailandTrinidad and TobagoTurkeyUgandaUkraineUruguayUzbekistanVenezuelaVietnamWest IndiesWestern AfricaWestern AsiaWestern EuropeYemenZaireZimbabweAzores
Hmong
Race
Ancestry
AfghanAfricanAlaska NativeAlaskan AthabascanAlbanianAleutAlsatianAmericanApacheArabArapahoArgentineanArmenianAssyrian/Chaldean/SyriacAustralianAustrianBahamianBangladeshiBarbadianBasqueBelgianBelizeanBermudanBhutaneseBlackfeetBolivianBrazilianBritishBritish West IndianBulgarianBurmeseCajunCambodianCanadianCape VerdeanCarpatho RusynCelticCentral AmericanCentral American IndianCherokeeCheyenneChickasawChileanChineseChippewaChoctawColombianColvilleComancheCosta RicanCreeCreekCroatianCrowCubanCypriotCzechCzechoslovakianDanishDelawareDominicanDutchDutch West IndianEastern EuropeanEcuadorianEgyptianEnglishEstonianEthiopianEuropeanFijianFilipinoFinnishFrenchFrench American IndianFrench CanadianGermanGerman RussianGhanaianGreekGuamanian/ChamorroGuatemalanGuyaneseHaitianHmongHonduranHopiHoumaHungarianIcelanderIndian (Asian)IndonesianInupiatIranianIraqiIrishIroquoisIsraeliItalianJamaicanJapaneseJordanianKenyanKiowaKoreanLaotianLatvianLebaneseLiberianLithuanianLumbeeLuxembourgerMacedonianMalaysianMalteseMarshalleseMenomineeMexicanMexican American IndianMongolianMoroccanNative HawaiianNavajoNepaleseNew ZealanderNicaraguanNigerianNorthern EuropeanNorwegianOkinawanOsageOttawaPaiutePakistaniPalestinianPanamanianParaguayanPennsylvania GermanPeruvianPimaPolishPortuguesePotawatomiPuebloPuerto RicanPuget Sound SalishRomanianRussianSalvadoranSamoanScandinavianScotch-IrishScottishSeminoleSenegaleseSerbianShoshoneSierra LeoneanSiouxSlavicSlovakSloveneSomaliSouth AfricanSouth AmericanSouth American IndianSoviet UnionSpaniardSpanishSpanish AmericanSpanish American IndianSri LankanSubsaharan AfricanSudaneseSwedishSwissSyrianTaiwaneseThaiTlingit-HaidaTohono O'OdhamTonganTrinidadian and TobagonianTsimshianTurkishU.S. Virgin IslanderUgandanUkrainianUruguayanUteVenezuelanVietnameseWelshWest IndianYakamaYaquiYugoslavianYumanYup'ikZimbabwean
Immigration
NonimmigrantsImmigrantsAfghanistanAfricaAlbaniaArgentinaArmeniaAsiaAustraliaAustriaBahamasBangladeshBarbadosBelarusBelgiumBelizeBoliviaBosnia and HerzegovinaBrazilBulgariaBurma/MyanmarCabo VerdeCambodiaCameroonCanadaCaribbeanCentral AmericaChileChinaColombiaCongoCosta RicaCroatiaCubaCzechoslovakiaDenmarkDominicaDominican RepublicEastern AfricaEastern AsiaEastern EuropeEcuadorEgyptEl SalvadorEnglandEritreaEthiopiaEuropeFijiFranceGermanyGhanaGreeceGrenadaGuatemalaGuyanaHaitiHondurasHong KongHungaryIndiaIndonesiaIranIraqIrelandIsraelItalyJamaicaJapanJordanKazakhstanKenyaKoreaKuwaitLaosLatin AmericaLatviaLebanonLiberiaLithuaniaMalaysiaMexicoMicronesiaMiddle AfricaMoldovaMoroccoNepalNetherlandsNicaraguaNigeriaNorth AmericaNorth MacedoniaNorthern AfricaNorthern EuropeNorwayOceaniaPakistanPanamaPeruPhilippinesPolandPortugalRomaniaRussiaSaudi ArabiaScotlandSenegalSierra LeoneSingaporeSomaliaSouth AfricaSouth AmericaSouth Central AsiaSouth Eastern AsiaSouthern EuropeSpainSri LankaSt. Vincent and the GrenadinesSudanSwedenSwitzerlandSyriaTaiwanThailandTrinidad and TobagoTurkeyUgandaUkraineUruguayUzbekistanVenezuelaVietnamWest IndiesWestern AfricaWestern AsiaWestern EuropeYemenZaireZimbabweAzores
In Labor Force | Age 35-44
Income
Poverty
Unemployment
Labor Participation
Family Structure
Vehicle Availability
Education Level
Disability

In Labor Force | Age 35-44 Comparison

Immigrants from Serbia

Hmong

Exceptional
Tragic
85.5%
IN LABOR FORCE | AGE 35-44
100.0/ 100
METRIC RATING
20th/ 347
METRIC RANK
82.6%
IN LABOR FORCE | AGE 35-44
0.0/ 100
METRIC RATING
297th/ 347
METRIC RANK

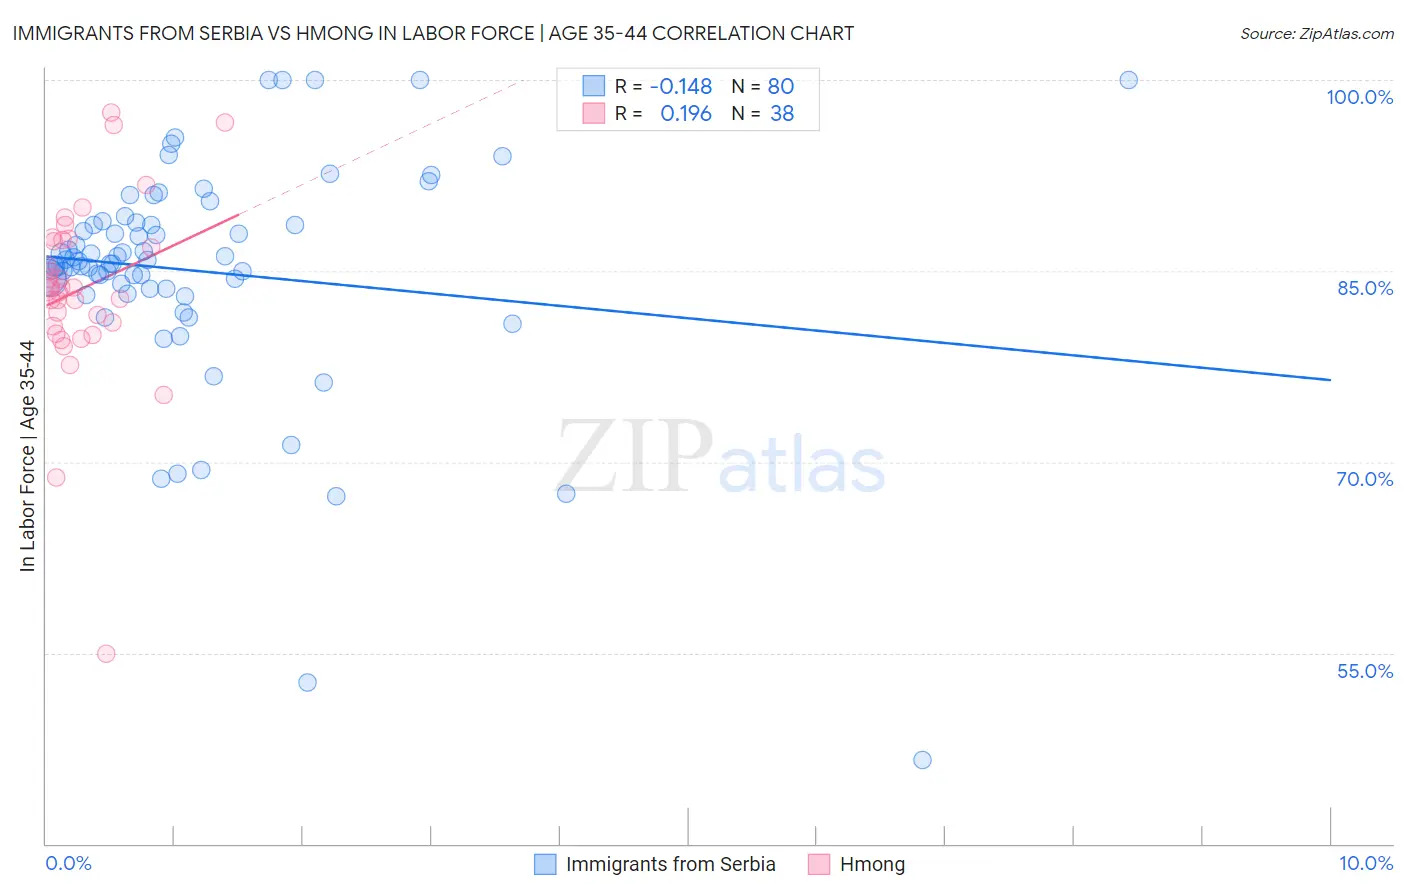
Immigrants from Serbia vs Hmong In Labor Force | Age 35-44 Correlation Chart

The statistical analysis conducted on geographies consisting of 131,723,933 people shows a poor negative correlation between the proportion of Immigrants from Serbia and labor force participation rate among population between the ages 35 and 44 in the United States with a correlation coefficient (R) of -0.148 and weighted average of 85.5%. Similarly, the statistical analysis conducted on geographies consisting of 24,669,739 people shows a poor positive correlation between the proportion of Hmong and labor force participation rate among population between the ages 35 and 44 in the United States with a correlation coefficient (R) of 0.196 and weighted average of 82.6%, a difference of 3.6%.
Immigrants from Serbia vs Hmong In Labor Force | Age 35-44

In Labor Force | Age 35-44 Correlation Summary

MeasurementImmigrants from SerbiaHmong
Minimum46.6%54.9%
Maximum100.0%97.4%
Range53.4%42.5%
Mean85.0%83.6%
Median85.7%83.7%
Interquartile 25% (IQ1)83.6%80.7%
Interquartile 75% (IQ3)88.7%87.4%
Interquartile Range (IQR)5.1%6.7%
Standard Deviation (Sample)9.0%7.4%
Standard Deviation (Population)8.9%7.3%

Similar Demographics by In Labor Force | Age 35-44

Demographics Similar to Immigrants from Serbia by In Labor Force | Age 35-44

In terms of in labor force | age 35-44, the demographic groups most similar to Immigrants from Serbia are Slovene (85.6%, a difference of 0.040%), Immigrants from North Macedonia (85.6%, a difference of 0.050%), Carpatho Rusyn (85.6%, a difference of 0.050%), Bulgarian (85.5%, a difference of 0.060%), and Norwegian (85.6%, a difference of 0.10%).
DemographicsRating | RankIn Labor Force | Age 35-44
Somalis
100.0
/100
|
#13
Exceptional
85.6%
Immigrants | Somalia
100.0
/100
|
#14
Exceptional
85.6%
Norwegians
100.0
/100
|
#15
Exceptional
85.6%
Immigrants | Ireland
100.0
/100
|
#16
Exceptional
85.6%
Immigrants | North Macedonia
100.0
/100
|
#17
Exceptional
85.6%
Carpatho Rusyns
100.0
/100
|
#18
Exceptional
85.6%
Slovenes
100.0
/100
|
#19
Exceptional
85.6%
Immigrants | Serbia
100.0
/100
|
#20
Exceptional
85.5%
Bulgarians
100.0
/100
|
#21
Exceptional
85.5%
Immigrants | Bosnia and Herzegovina
100.0
/100
|
#22
Exceptional
85.4%
Immigrants | Eastern Africa
100.0
/100
|
#23
Exceptional
85.4%
Latvians
99.9
/100
|
#24
Exceptional
85.4%
Paraguayans
99.9
/100
|
#25
Exceptional
85.4%
Immigrants | Liberia
99.9
/100
|
#26
Exceptional
85.4%
Immigrants | Lithuania
99.9
/100
|
#27
Exceptional
85.4%

Demographics Similar to Hmong by In Labor Force | Age 35-44

In terms of in labor force | age 35-44, the demographic groups most similar to Hmong are Mexican American Indian (82.6%, a difference of 0.010%), Ottawa (82.6%, a difference of 0.020%), Tlingit-Haida (82.5%, a difference of 0.030%), Central American Indian (82.5%, a difference of 0.090%), and Immigrants from Lebanon (82.7%, a difference of 0.10%).
DemographicsRating | RankIn Labor Force | Age 35-44
Africans
0.0
/100
|
#290
Tragic
82.9%
Pennsylvania Germans
0.0
/100
|
#291
Tragic
82.9%
Immigrants | Latin America
0.0
/100
|
#292
Tragic
82.8%
Spanish Americans
0.0
/100
|
#293
Tragic
82.8%
Potawatomi
0.0
/100
|
#294
Tragic
82.7%
Immigrants | Lebanon
0.0
/100
|
#295
Tragic
82.7%
Mexican American Indians
0.0
/100
|
#296
Tragic
82.6%
Hmong
0.0
/100
|
#297
Tragic
82.6%
Ottawa
0.0
/100
|
#298
Tragic
82.6%
Tlingit-Haida
0.0
/100
|
#299
Tragic
82.5%
Central American Indians
0.0
/100
|
#300
Tragic
82.5%
Spanish American Indians
0.0
/100
|
#301
Tragic
82.5%
Americans
0.0
/100
|
#302
Tragic
82.4%
Nepalese
0.0
/100
|
#303
Tragic
82.4%
Marshallese
0.0
/100
|
#304
Tragic
82.4%