Czechoslovakian vs Creek Median Earnings
COMPARE
Czechoslovakian
Creek
Median Earnings
Median Earnings Comparison
Czechoslovakians
Creek
$46,658
MEDIAN EARNINGS
57.8/ 100
METRIC RATING
166th/ 347
METRIC RANK
$39,648
MEDIAN EARNINGS
0.0/ 100
METRIC RATING
325th/ 347
METRIC RANK
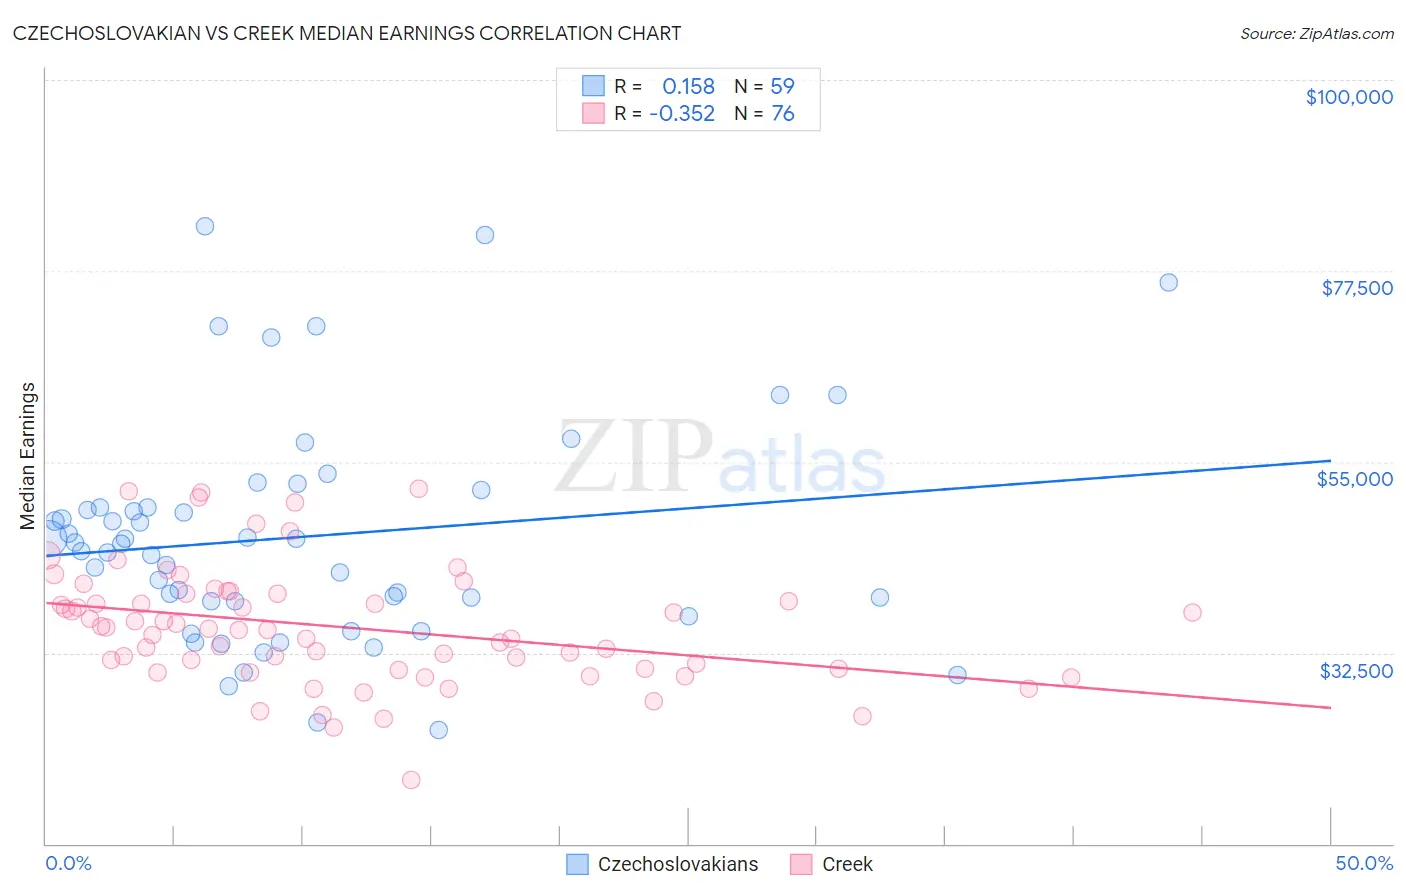
Czechoslovakian vs Creek Median Earnings Correlation Chart
The statistical analysis conducted on geographies consisting of 368,633,648 people shows a poor positive correlation between the proportion of Czechoslovakians and median earnings in the United States with a correlation coefficient (R) of 0.158 and weighted average of $46,658. Similarly, the statistical analysis conducted on geographies consisting of 178,470,234 people shows a mild negative correlation between the proportion of Creek and median earnings in the United States with a correlation coefficient (R) of -0.352 and weighted average of $39,648, a difference of 17.7%.
Median Earnings Correlation Summary
| Measurement | Czechoslovakian | Creek |
| Minimum | $23,333 | $17,500 |
| Maximum | $82,793 | $51,875 |
| Range | $59,460 | $34,375 |
| Mean | $46,151 | $35,536 |
| Median | $45,298 | $35,262 |
| Interquartile 25% (IQ1) | $38,524 | $30,664 |
| Interquartile 75% (IQ3) | $49,625 | $39,531 |
| Interquartile Range (IQR) | $11,101 | $8,868 |
| Standard Deviation (Sample) | $13,082 | $6,944 |
| Standard Deviation (Population) | $12,971 | $6,899 |
Similar Demographics by Median Earnings
Demographics Similar to Czechoslovakians by Median Earnings
In terms of median earnings, the demographic groups most similar to Czechoslovakians are Costa Rican ($46,645, a difference of 0.030%), Immigrants from Africa ($46,564, a difference of 0.20%), Immigrants from South America ($46,548, a difference of 0.24%), South American ($46,804, a difference of 0.31%), and Immigrants ($46,478, a difference of 0.39%).
| Demographics | Rating | Rank | Median Earnings |
| Immigrants | Peru | 69.6 /100 | #159 | Good $47,025 |
| Alsatians | 69.6 /100 | #160 | Good $47,023 |
| Immigrants | Eastern Africa | 68.0 /100 | #161 | Good $46,969 |
| South American Indians | 67.4 /100 | #162 | Good $46,952 |
| Icelanders | 66.3 /100 | #163 | Good $46,916 |
| Norwegians | 64.7 /100 | #164 | Good $46,865 |
| South Americans | 62.7 /100 | #165 | Good $46,804 |
| Czechoslovakians | 57.8 /100 | #166 | Average $46,658 |
| Costa Ricans | 57.4 /100 | #167 | Average $46,645 |
| Immigrants | Africa | 54.6 /100 | #168 | Average $46,564 |
| Immigrants | South America | 54.0 /100 | #169 | Average $46,548 |
| Immigrants | Immigrants | 51.6 /100 | #170 | Average $46,478 |
| Scottish | 51.1 /100 | #171 | Average $46,463 |
| Kenyans | 51.0 /100 | #172 | Average $46,462 |
| Ghanaians | 50.3 /100 | #173 | Average $46,440 |
Demographics Similar to Creek by Median Earnings
In terms of median earnings, the demographic groups most similar to Creek are Ottawa ($39,721, a difference of 0.18%), Bahamian ($39,735, a difference of 0.22%), Immigrants from Yemen ($39,540, a difference of 0.27%), Immigrants from Central America ($39,762, a difference of 0.29%), and Yuman ($39,523, a difference of 0.32%).
| Demographics | Rating | Rank | Median Earnings |
| Dutch West Indians | 0.0 /100 | #318 | Tragic $40,107 |
| Blacks/African Americans | 0.0 /100 | #319 | Tragic $40,085 |
| Immigrants | Bahamas | 0.0 /100 | #320 | Tragic $39,861 |
| Mexicans | 0.0 /100 | #321 | Tragic $39,834 |
| Immigrants | Central America | 0.0 /100 | #322 | Tragic $39,762 |
| Bahamians | 0.0 /100 | #323 | Tragic $39,735 |
| Ottawa | 0.0 /100 | #324 | Tragic $39,721 |
| Creek | 0.0 /100 | #325 | Tragic $39,648 |
| Immigrants | Yemen | 0.0 /100 | #326 | Tragic $39,540 |
| Yuman | 0.0 /100 | #327 | Tragic $39,523 |
| Sioux | 0.0 /100 | #328 | Tragic $39,448 |
| Kiowa | 0.0 /100 | #329 | Tragic $39,232 |
| Immigrants | Congo | 0.0 /100 | #330 | Tragic $39,169 |
| Immigrants | Mexico | 0.0 /100 | #331 | Tragic $39,114 |
| Yakama | 0.0 /100 | #332 | Tragic $39,107 |