Czechoslovakian vs Native/Alaskan In Labor Force | Age 20-24
COMPARE
Czechoslovakian
Native/Alaskan
In Labor Force | Age 20-24
In Labor Force | Age 20-24 Comparison
Czechoslovakians
Natives/Alaskans
77.5%
IN LABOR FORCE | AGE 20-24
100.0/ 100
METRIC RATING
37th/ 347
METRIC RANK
72.4%
IN LABOR FORCE | AGE 20-24
0.0/ 100
METRIC RATING
302nd/ 347
METRIC RANK
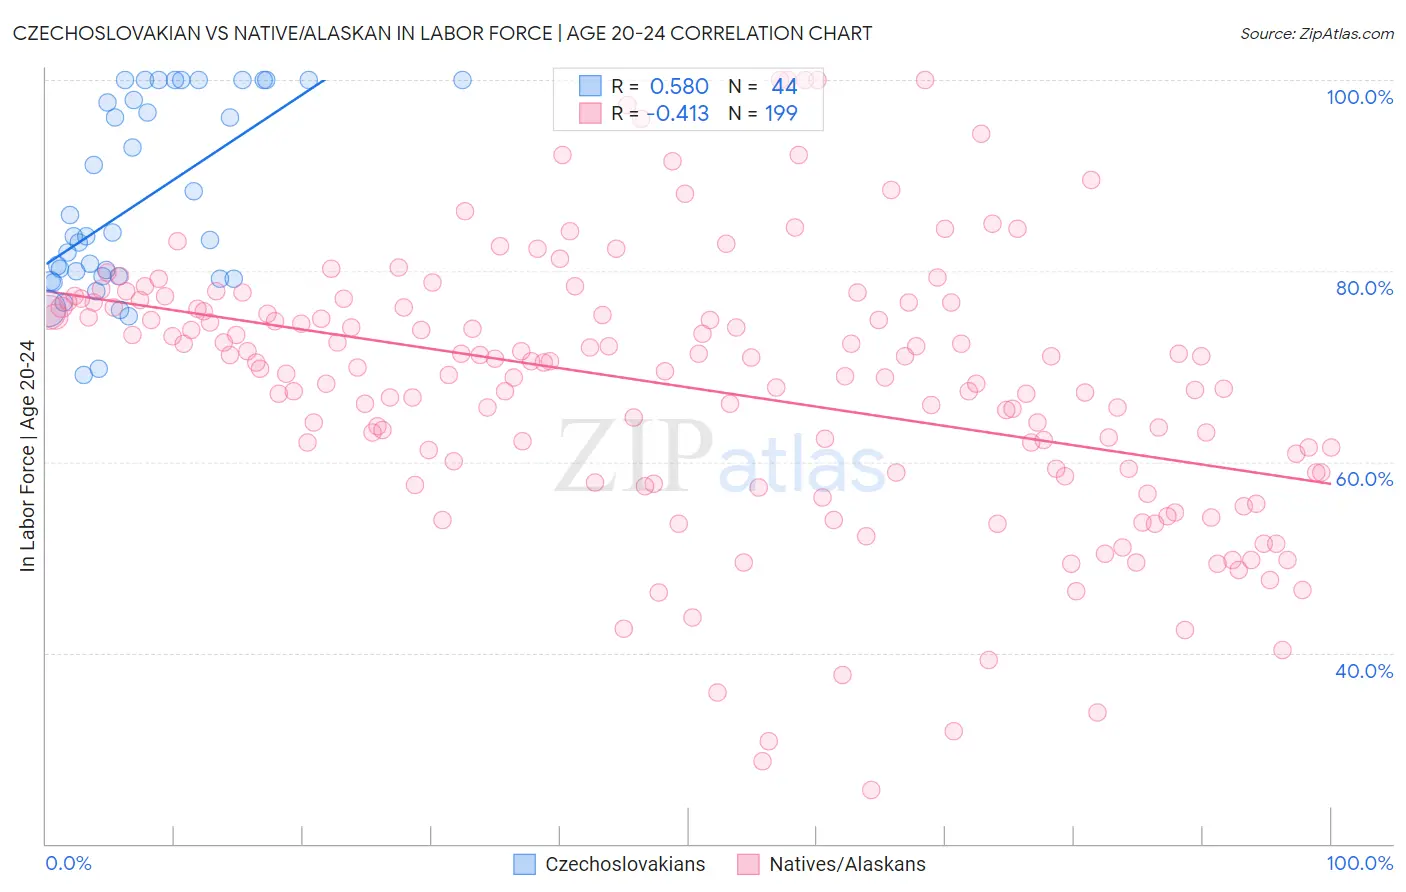
Czechoslovakian vs Native/Alaskan In Labor Force | Age 20-24 Correlation Chart
The statistical analysis conducted on geographies consisting of 368,456,414 people shows a substantial positive correlation between the proportion of Czechoslovakians and labor force participation rate among population between the ages 20 and 24 in the United States with a correlation coefficient (R) of 0.580 and weighted average of 77.5%. Similarly, the statistical analysis conducted on geographies consisting of 512,418,491 people shows a moderate negative correlation between the proportion of Natives/Alaskans and labor force participation rate among population between the ages 20 and 24 in the United States with a correlation coefficient (R) of -0.413 and weighted average of 72.4%, a difference of 7.0%.
In Labor Force | Age 20-24 Correlation Summary
| Measurement | Czechoslovakian | Native/Alaskan |
| Minimum | 69.1% | 25.7% |
| Maximum | 100.0% | 100.0% |
| Range | 30.9% | 74.3% |
| Mean | 87.3% | 67.8% |
| Median | 83.6% | 69.8% |
| Interquartile 25% (IQ1) | 79.3% | 58.9% |
| Interquartile 75% (IQ3) | 98.9% | 76.2% |
| Interquartile Range (IQR) | 19.6% | 17.3% |
| Standard Deviation (Sample) | 10.0% | 14.2% |
| Standard Deviation (Population) | 9.8% | 14.2% |
Similar Demographics by In Labor Force | Age 20-24
Demographics Similar to Czechoslovakians by In Labor Force | Age 20-24
In terms of in labor force | age 20-24, the demographic groups most similar to Czechoslovakians are Welsh (77.5%, a difference of 0.010%), Immigrants from Eastern Africa (77.5%, a difference of 0.030%), Immigrants from Ethiopia (77.5%, a difference of 0.050%), German Russian (77.5%, a difference of 0.050%), and Marshallese (77.4%, a difference of 0.050%).
| Demographics | Rating | Rank | In Labor Force | Age 20-24 |
| Swiss | 100.0 /100 | #30 | Exceptional 77.7% |
| Poles | 100.0 /100 | #31 | Exceptional 77.6% |
| English | 100.0 /100 | #32 | Exceptional 77.6% |
| Immigrants | Ethiopia | 100.0 /100 | #33 | Exceptional 77.5% |
| German Russians | 100.0 /100 | #34 | Exceptional 77.5% |
| Immigrants | Eastern Africa | 100.0 /100 | #35 | Exceptional 77.5% |
| Welsh | 100.0 /100 | #36 | Exceptional 77.5% |
| Czechoslovakians | 100.0 /100 | #37 | Exceptional 77.5% |
| Marshallese | 100.0 /100 | #38 | Exceptional 77.4% |
| Irish | 100.0 /100 | #39 | Exceptional 77.4% |
| Scottish | 100.0 /100 | #40 | Exceptional 77.4% |
| Immigrants | Congo | 100.0 /100 | #41 | Exceptional 77.4% |
| French | 100.0 /100 | #42 | Exceptional 77.4% |
| Immigrants | Laos | 100.0 /100 | #43 | Exceptional 77.4% |
| Fijians | 100.0 /100 | #44 | Exceptional 77.4% |
Demographics Similar to Natives/Alaskans by In Labor Force | Age 20-24
In terms of in labor force | age 20-24, the demographic groups most similar to Natives/Alaskans are Ecuadorian (72.4%, a difference of 0.010%), Immigrants from West Indies (72.4%, a difference of 0.020%), Immigrants from Singapore (72.4%, a difference of 0.050%), Immigrants from Jamaica (72.4%, a difference of 0.070%), and Cuban (72.5%, a difference of 0.090%).
| Demographics | Rating | Rank | In Labor Force | Age 20-24 |
| Okinawans | 0.0 /100 | #295 | Tragic 72.7% |
| Jamaicans | 0.0 /100 | #296 | Tragic 72.7% |
| Central American Indians | 0.0 /100 | #297 | Tragic 72.7% |
| Israelis | 0.0 /100 | #298 | Tragic 72.6% |
| Iranians | 0.0 /100 | #299 | Tragic 72.6% |
| Armenians | 0.0 /100 | #300 | Tragic 72.5% |
| Cubans | 0.0 /100 | #301 | Tragic 72.5% |
| Natives/Alaskans | 0.0 /100 | #302 | Tragic 72.4% |
| Ecuadorians | 0.0 /100 | #303 | Tragic 72.4% |
| Immigrants | West Indies | 0.0 /100 | #304 | Tragic 72.4% |
| Immigrants | Singapore | 0.0 /100 | #305 | Tragic 72.4% |
| Immigrants | Jamaica | 0.0 /100 | #306 | Tragic 72.4% |
| Immigrants | Ecuador | 0.0 /100 | #307 | Tragic 72.3% |
| Soviet Union | 0.0 /100 | #308 | Tragic 72.3% |
| Tsimshian | 0.0 /100 | #309 | Tragic 72.3% |