Czechoslovakian vs Swedish In Labor Force | Age 20-24
COMPARE
Czechoslovakian
Swedish
In Labor Force | Age 20-24
In Labor Force | Age 20-24 Comparison
Czechoslovakians
Swedes
77.5%
IN LABOR FORCE | AGE 20-24
100.0/ 100
METRIC RATING
37th/ 347
METRIC RANK
78.8%
IN LABOR FORCE | AGE 20-24
100.0/ 100
METRIC RATING
9th/ 347
METRIC RANK
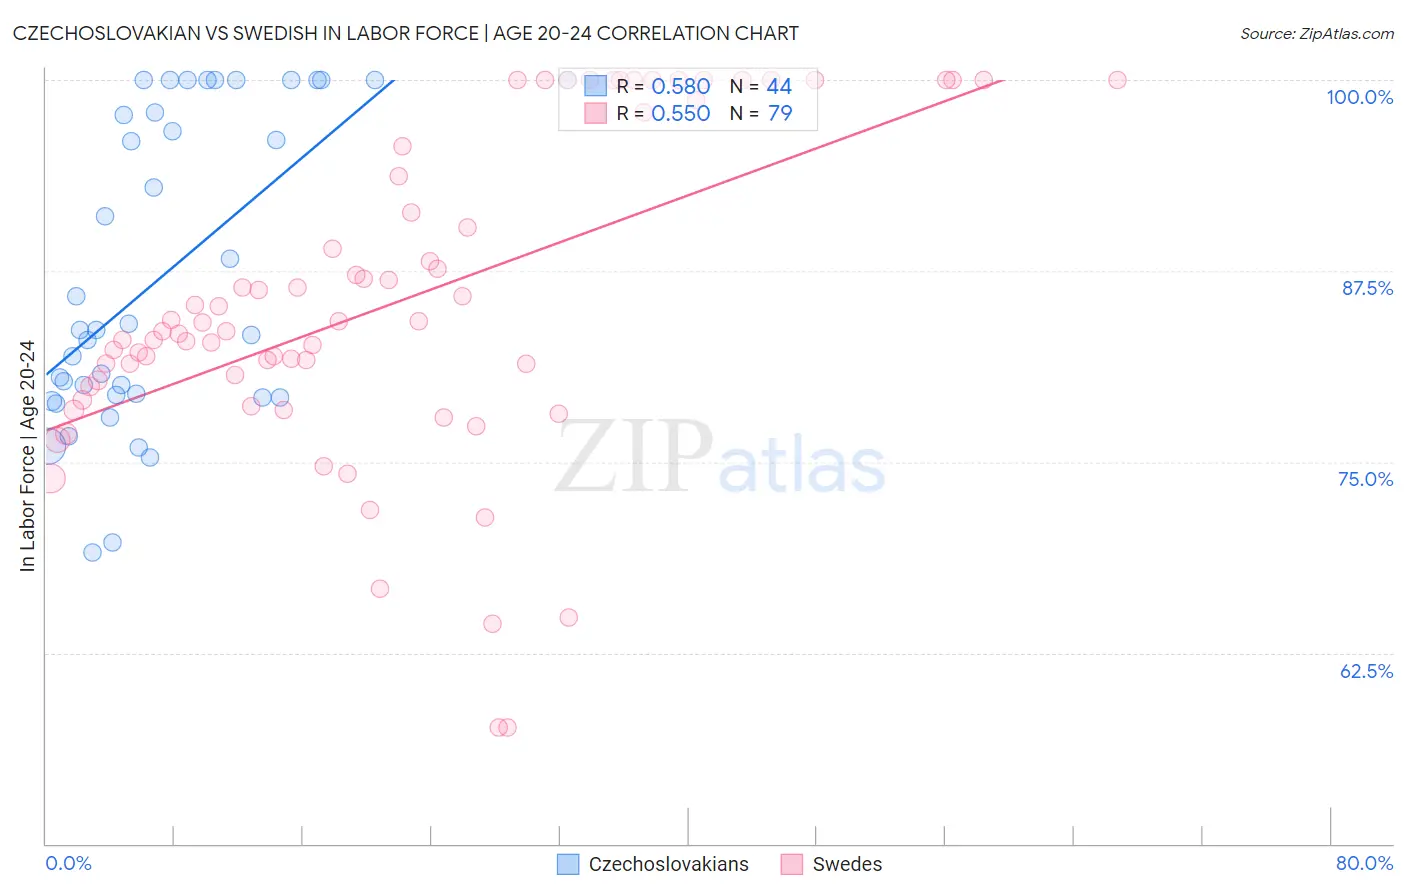
Czechoslovakian vs Swedish In Labor Force | Age 20-24 Correlation Chart
The statistical analysis conducted on geographies consisting of 368,456,414 people shows a substantial positive correlation between the proportion of Czechoslovakians and labor force participation rate among population between the ages 20 and 24 in the United States with a correlation coefficient (R) of 0.580 and weighted average of 77.5%. Similarly, the statistical analysis conducted on geographies consisting of 538,164,941 people shows a substantial positive correlation between the proportion of Swedes and labor force participation rate among population between the ages 20 and 24 in the United States with a correlation coefficient (R) of 0.550 and weighted average of 78.8%, a difference of 1.7%.
In Labor Force | Age 20-24 Correlation Summary
| Measurement | Czechoslovakian | Swedish |
| Minimum | 69.1% | 57.6% |
| Maximum | 100.0% | 100.0% |
| Range | 30.9% | 42.4% |
| Mean | 87.3% | 85.4% |
| Median | 83.6% | 83.6% |
| Interquartile 25% (IQ1) | 79.3% | 80.0% |
| Interquartile 75% (IQ3) | 98.9% | 95.6% |
| Interquartile Range (IQR) | 19.6% | 15.7% |
| Standard Deviation (Sample) | 10.0% | 10.4% |
| Standard Deviation (Population) | 9.8% | 10.4% |
Similar Demographics by In Labor Force | Age 20-24
Demographics Similar to Czechoslovakians by In Labor Force | Age 20-24
In terms of in labor force | age 20-24, the demographic groups most similar to Czechoslovakians are Welsh (77.5%, a difference of 0.010%), Immigrants from Eastern Africa (77.5%, a difference of 0.030%), Immigrants from Ethiopia (77.5%, a difference of 0.050%), German Russian (77.5%, a difference of 0.050%), and Marshallese (77.4%, a difference of 0.050%).
| Demographics | Rating | Rank | In Labor Force | Age 20-24 |
| Swiss | 100.0 /100 | #30 | Exceptional 77.7% |
| Poles | 100.0 /100 | #31 | Exceptional 77.6% |
| English | 100.0 /100 | #32 | Exceptional 77.6% |
| Immigrants | Ethiopia | 100.0 /100 | #33 | Exceptional 77.5% |
| German Russians | 100.0 /100 | #34 | Exceptional 77.5% |
| Immigrants | Eastern Africa | 100.0 /100 | #35 | Exceptional 77.5% |
| Welsh | 100.0 /100 | #36 | Exceptional 77.5% |
| Czechoslovakians | 100.0 /100 | #37 | Exceptional 77.5% |
| Marshallese | 100.0 /100 | #38 | Exceptional 77.4% |
| Irish | 100.0 /100 | #39 | Exceptional 77.4% |
| Scottish | 100.0 /100 | #40 | Exceptional 77.4% |
| Immigrants | Congo | 100.0 /100 | #41 | Exceptional 77.4% |
| French | 100.0 /100 | #42 | Exceptional 77.4% |
| Immigrants | Laos | 100.0 /100 | #43 | Exceptional 77.4% |
| Fijians | 100.0 /100 | #44 | Exceptional 77.4% |
Demographics Similar to Swedes by In Labor Force | Age 20-24
In terms of in labor force | age 20-24, the demographic groups most similar to Swedes are Immigrants from Cabo Verde (78.9%, a difference of 0.070%), Slovene (78.7%, a difference of 0.16%), Luxembourger (79.0%, a difference of 0.17%), Finnish (78.7%, a difference of 0.19%), and Danish (79.0%, a difference of 0.21%).
| Demographics | Rating | Rank | In Labor Force | Age 20-24 |
| Immigrants | Somalia | 100.0 /100 | #2 | Exceptional 79.5% |
| Somalis | 100.0 /100 | #3 | Exceptional 79.3% |
| Alaskan Athabascans | 100.0 /100 | #4 | Exceptional 79.1% |
| Aleuts | 100.0 /100 | #5 | Exceptional 79.0% |
| Danes | 100.0 /100 | #6 | Exceptional 79.0% |
| Luxembourgers | 100.0 /100 | #7 | Exceptional 79.0% |
| Immigrants | Cabo Verde | 100.0 /100 | #8 | Exceptional 78.9% |
| Swedes | 100.0 /100 | #9 | Exceptional 78.8% |
| Slovenes | 100.0 /100 | #10 | Exceptional 78.7% |
| Finns | 100.0 /100 | #11 | Exceptional 78.7% |
| Germans | 100.0 /100 | #12 | Exceptional 78.6% |
| Scandinavians | 100.0 /100 | #13 | Exceptional 78.5% |
| Czechs | 100.0 /100 | #14 | Exceptional 78.5% |
| Sudanese | 100.0 /100 | #15 | Exceptional 78.4% |
| Dutch | 100.0 /100 | #16 | Exceptional 78.4% |