Romanian vs Immigrants from Panama In Labor Force | Age 20-24
COMPARE
Romanian
Immigrants from Panama
In Labor Force | Age 20-24
In Labor Force | Age 20-24 Comparison
Romanians
Immigrants from Panama
75.5%
IN LABOR FORCE | AGE 20-24
84.1/ 100
METRIC RATING
141st/ 347
METRIC RANK
73.9%
IN LABOR FORCE | AGE 20-24
1.6/ 100
METRIC RATING
246th/ 347
METRIC RANK
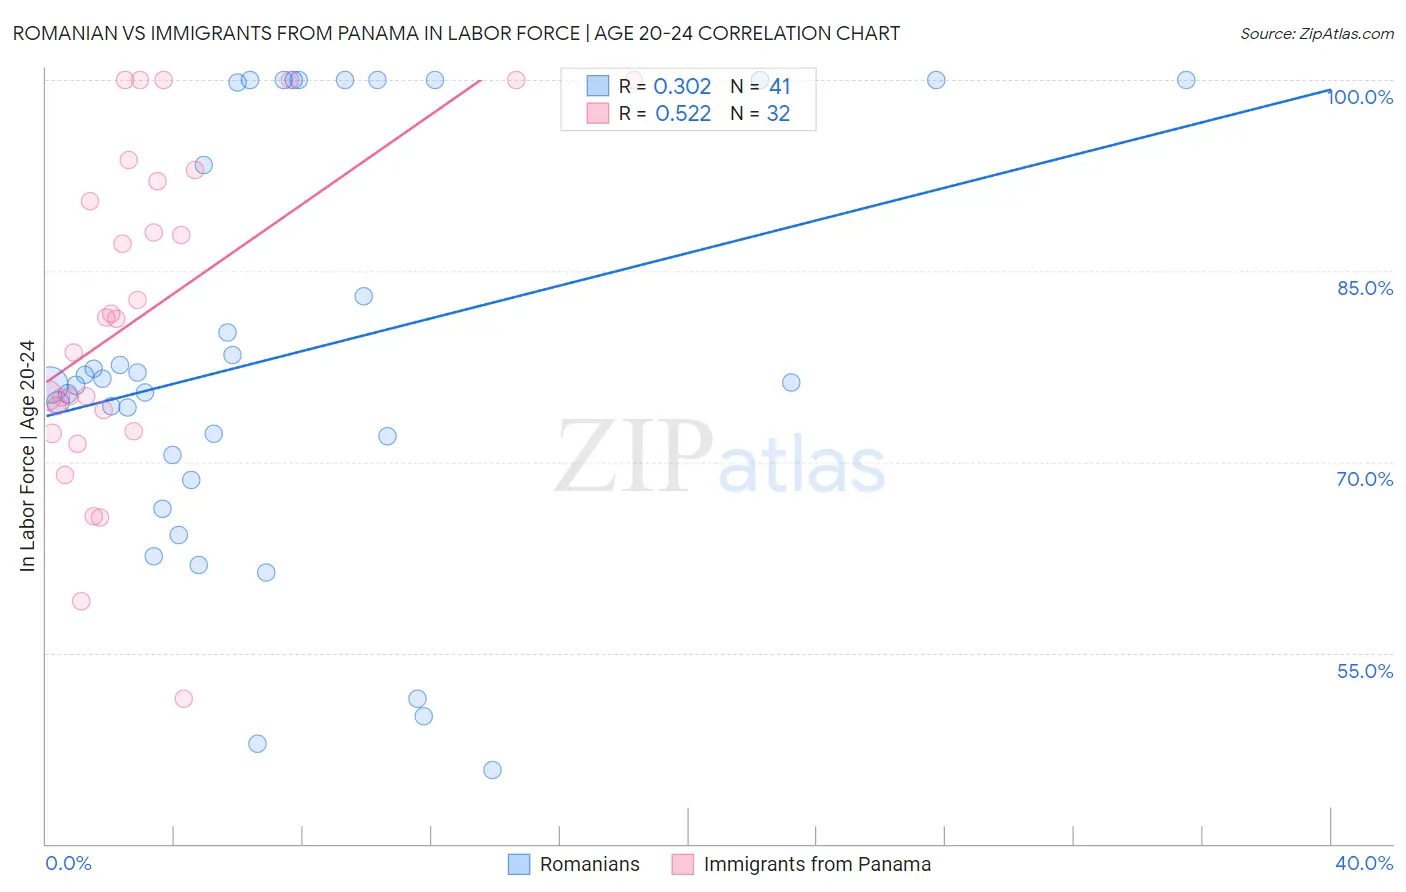
Romanian vs Immigrants from Panama In Labor Force | Age 20-24 Correlation Chart
The statistical analysis conducted on geographies consisting of 377,715,651 people shows a mild positive correlation between the proportion of Romanians and labor force participation rate among population between the ages 20 and 24 in the United States with a correlation coefficient (R) of 0.302 and weighted average of 75.5%. Similarly, the statistical analysis conducted on geographies consisting of 221,162,979 people shows a substantial positive correlation between the proportion of Immigrants from Panama and labor force participation rate among population between the ages 20 and 24 in the United States with a correlation coefficient (R) of 0.522 and weighted average of 73.9%, a difference of 2.2%.
In Labor Force | Age 20-24 Correlation Summary
| Measurement | Romanian | Immigrants from Panama |
| Minimum | 45.8% | 51.4% |
| Maximum | 100.0% | 100.0% |
| Range | 54.2% | 48.6% |
| Mean | 78.5% | 81.7% |
| Median | 76.2% | 81.3% |
| Interquartile 25% (IQ1) | 69.6% | 73.3% |
| Interquartile 75% (IQ3) | 99.9% | 92.4% |
| Interquartile Range (IQR) | 30.3% | 19.2% |
| Standard Deviation (Sample) | 16.1% | 13.0% |
| Standard Deviation (Population) | 15.9% | 12.8% |
Similar Demographics by In Labor Force | Age 20-24
Demographics Similar to Romanians by In Labor Force | Age 20-24
In terms of in labor force | age 20-24, the demographic groups most similar to Romanians are Immigrants from England (75.5%, a difference of 0.010%), Delaware (75.5%, a difference of 0.010%), Blackfeet (75.5%, a difference of 0.010%), Immigrants from Brazil (75.5%, a difference of 0.020%), and Jordanian (75.5%, a difference of 0.020%).
| Demographics | Rating | Rank | In Labor Force | Age 20-24 |
| Estonians | 87.1 /100 | #134 | Excellent 75.6% |
| Yaqui | 85.5 /100 | #135 | Excellent 75.5% |
| Immigrants | Brazil | 84.8 /100 | #136 | Excellent 75.5% |
| Jordanians | 84.8 /100 | #137 | Excellent 75.5% |
| Australians | 84.8 /100 | #138 | Excellent 75.5% |
| Immigrants | England | 84.6 /100 | #139 | Excellent 75.5% |
| Delaware | 84.5 /100 | #140 | Excellent 75.5% |
| Romanians | 84.1 /100 | #141 | Excellent 75.5% |
| Blackfeet | 83.6 /100 | #142 | Excellent 75.5% |
| Spaniards | 82.0 /100 | #143 | Excellent 75.5% |
| Bhutanese | 80.8 /100 | #144 | Excellent 75.4% |
| Koreans | 79.7 /100 | #145 | Good 75.4% |
| Mexican American Indians | 78.8 /100 | #146 | Good 75.4% |
| Comanche | 77.6 /100 | #147 | Good 75.4% |
| Immigrants | Cambodia | 76.7 /100 | #148 | Good 75.4% |
Demographics Similar to Immigrants from Panama by In Labor Force | Age 20-24
In terms of in labor force | age 20-24, the demographic groups most similar to Immigrants from Panama are Colville (73.9%, a difference of 0.030%), Immigrants from Saudi Arabia (73.9%, a difference of 0.030%), Turkish (73.9%, a difference of 0.040%), Immigrants from South Central Asia (74.0%, a difference of 0.060%), and Immigrants from Syria (74.0%, a difference of 0.070%).
| Demographics | Rating | Rank | In Labor Force | Age 20-24 |
| Immigrants | Latin America | 2.7 /100 | #239 | Tragic 74.1% |
| Immigrants | Sri Lanka | 2.3 /100 | #240 | Tragic 74.0% |
| Immigrants | Senegal | 2.1 /100 | #241 | Tragic 74.0% |
| Thais | 2.1 /100 | #242 | Tragic 74.0% |
| Immigrants | Syria | 1.9 /100 | #243 | Tragic 74.0% |
| Immigrants | South Central Asia | 1.9 /100 | #244 | Tragic 74.0% |
| Turks | 1.8 /100 | #245 | Tragic 73.9% |
| Immigrants | Panama | 1.6 /100 | #246 | Tragic 73.9% |
| Colville | 1.5 /100 | #247 | Tragic 73.9% |
| Immigrants | Saudi Arabia | 1.5 /100 | #248 | Tragic 73.9% |
| Blacks/African Americans | 1.3 /100 | #249 | Tragic 73.9% |
| Immigrants | Belgium | 1.3 /100 | #250 | Tragic 73.9% |
| Immigrants | Egypt | 1.2 /100 | #251 | Tragic 73.8% |
| Immigrants | Kazakhstan | 1.1 /100 | #252 | Tragic 73.8% |
| Arapaho | 1.0 /100 | #253 | Tragic 73.8% |