Cypriot vs Immigrants from Australia In Labor Force | Age 20-24
COMPARE
Cypriot
Immigrants from Australia
In Labor Force | Age 20-24
In Labor Force | Age 20-24 Comparison
Cypriots
Immigrants from Australia
73.3%
IN LABOR FORCE | AGE 20-24
0.2/ 100
METRIC RATING
278th/ 347
METRIC RANK
74.6%
IN LABOR FORCE | AGE 20-24
14.7/ 100
METRIC RATING
211th/ 347
METRIC RANK
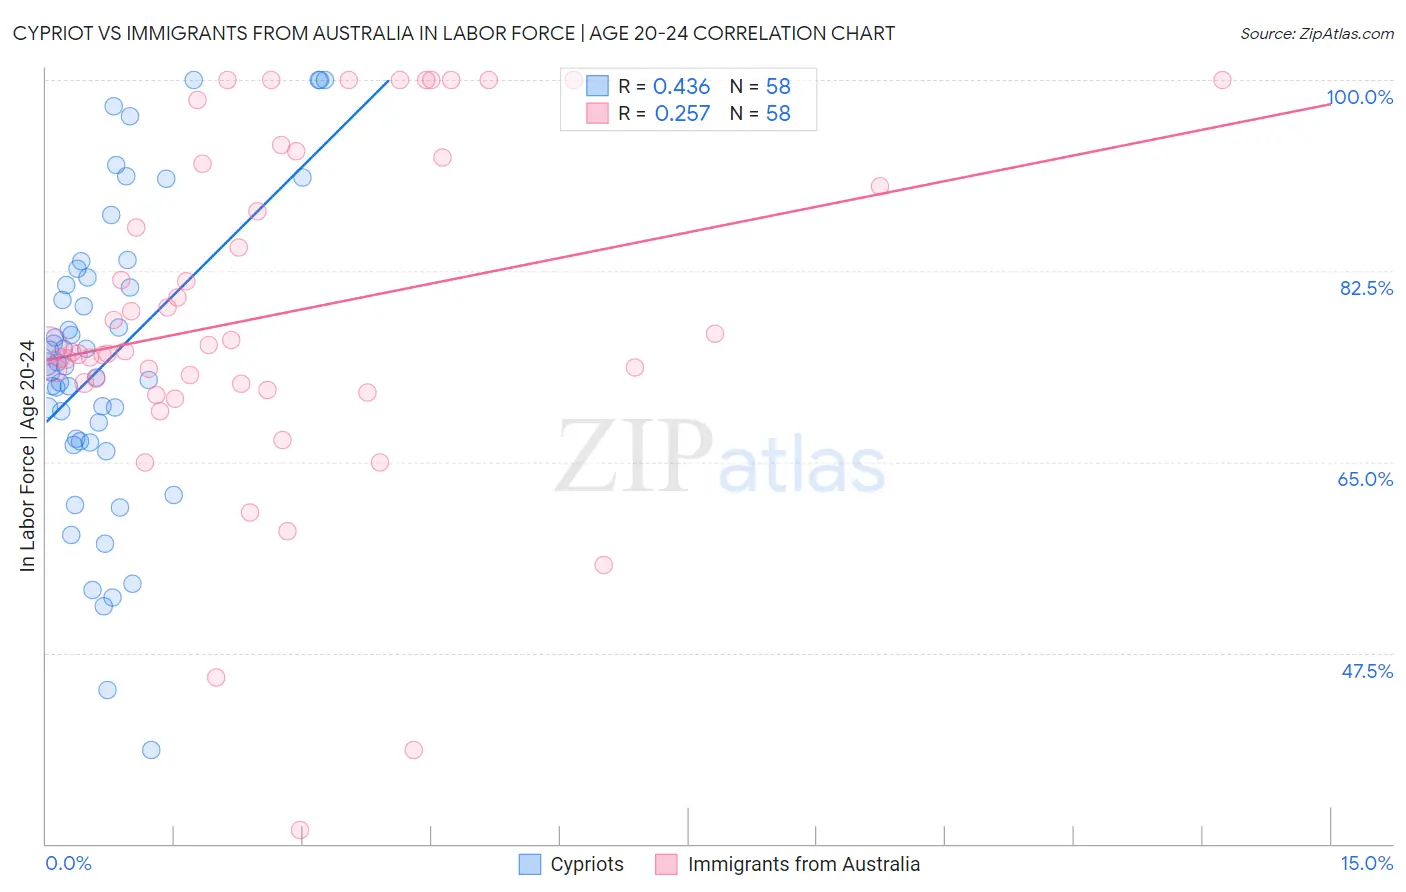
Cypriot vs Immigrants from Australia In Labor Force | Age 20-24 Correlation Chart
The statistical analysis conducted on geographies consisting of 61,866,486 people shows a moderate positive correlation between the proportion of Cypriots and labor force participation rate among population between the ages 20 and 24 in the United States with a correlation coefficient (R) of 0.436 and weighted average of 73.3%. Similarly, the statistical analysis conducted on geographies consisting of 227,133,823 people shows a weak positive correlation between the proportion of Immigrants from Australia and labor force participation rate among population between the ages 20 and 24 in the United States with a correlation coefficient (R) of 0.257 and weighted average of 74.6%, a difference of 1.7%.
In Labor Force | Age 20-24 Correlation Summary
| Measurement | Cypriot | Immigrants from Australia |
| Minimum | 38.6% | 31.2% |
| Maximum | 100.0% | 100.0% |
| Range | 61.4% | 68.8% |
| Mean | 74.4% | 78.5% |
| Median | 73.9% | 75.4% |
| Interquartile 25% (IQ1) | 66.9% | 72.2% |
| Interquartile 75% (IQ3) | 81.9% | 92.3% |
| Interquartile Range (IQR) | 15.0% | 20.1% |
| Standard Deviation (Sample) | 13.9% | 15.4% |
| Standard Deviation (Population) | 13.8% | 15.3% |
Similar Demographics by In Labor Force | Age 20-24
Demographics Similar to Cypriots by In Labor Force | Age 20-24
In terms of in labor force | age 20-24, the demographic groups most similar to Cypriots are Venezuelan (73.3%, a difference of 0.010%), Immigrants from Malaysia (73.3%, a difference of 0.020%), Mongolian (73.3%, a difference of 0.030%), Immigrants from South America (73.3%, a difference of 0.040%), and Bahamian (73.3%, a difference of 0.080%).
| Demographics | Rating | Rank | In Labor Force | Age 20-24 |
| Immigrants | Indonesia | 0.3 /100 | #271 | Tragic 73.4% |
| Belizeans | 0.3 /100 | #272 | Tragic 73.4% |
| Cheyenne | 0.2 /100 | #273 | Tragic 73.4% |
| Immigrants | Colombia | 0.2 /100 | #274 | Tragic 73.4% |
| Immigrants | South America | 0.2 /100 | #275 | Tragic 73.3% |
| Mongolians | 0.2 /100 | #276 | Tragic 73.3% |
| Immigrants | Malaysia | 0.2 /100 | #277 | Tragic 73.3% |
| Cypriots | 0.2 /100 | #278 | Tragic 73.3% |
| Venezuelans | 0.2 /100 | #279 | Tragic 73.3% |
| Bahamians | 0.1 /100 | #280 | Tragic 73.3% |
| Immigrants | Venezuela | 0.1 /100 | #281 | Tragic 73.2% |
| Immigrants | Spain | 0.1 /100 | #282 | Tragic 73.2% |
| Immigrants | Bahamas | 0.1 /100 | #283 | Tragic 73.2% |
| Kiowa | 0.1 /100 | #284 | Tragic 73.2% |
| Nicaraguans | 0.1 /100 | #285 | Tragic 73.2% |
Demographics Similar to Immigrants from Australia by In Labor Force | Age 20-24
In terms of in labor force | age 20-24, the demographic groups most similar to Immigrants from Australia are Uruguayan (74.6%, a difference of 0.010%), Immigrants from Uruguay (74.6%, a difference of 0.030%), Arab (74.6%, a difference of 0.030%), Albanian (74.6%, a difference of 0.040%), and Creek (74.5%, a difference of 0.040%).
| Demographics | Rating | Rank | In Labor Force | Age 20-24 |
| Immigrants | Italy | 17.6 /100 | #204 | Poor 74.6% |
| Inupiat | 17.6 /100 | #205 | Poor 74.6% |
| Sioux | 17.5 /100 | #206 | Poor 74.6% |
| Albanians | 16.2 /100 | #207 | Poor 74.6% |
| Immigrants | Uruguay | 15.8 /100 | #208 | Poor 74.6% |
| Arabs | 15.8 /100 | #209 | Poor 74.6% |
| Uruguayans | 15.1 /100 | #210 | Poor 74.6% |
| Immigrants | Australia | 14.7 /100 | #211 | Poor 74.6% |
| Creek | 13.3 /100 | #212 | Poor 74.5% |
| Peruvians | 13.3 /100 | #213 | Poor 74.5% |
| Immigrants | Southern Europe | 13.2 /100 | #214 | Poor 74.5% |
| Immigrants | Ghana | 12.7 /100 | #215 | Poor 74.5% |
| Immigrants | Kuwait | 12.7 /100 | #216 | Poor 74.5% |
| Chileans | 12.5 /100 | #217 | Poor 74.5% |
| Immigrants | Peru | 10.6 /100 | #218 | Poor 74.5% |