Cypriot vs Immigrants from Italy In Labor Force | Age 20-24
COMPARE
Cypriot
Immigrants from Italy
In Labor Force | Age 20-24
In Labor Force | Age 20-24 Comparison
Cypriots
Immigrants from Italy
73.3%
IN LABOR FORCE | AGE 20-24
0.2/ 100
METRIC RATING
278th/ 347
METRIC RANK
74.6%
IN LABOR FORCE | AGE 20-24
17.6/ 100
METRIC RATING
204th/ 347
METRIC RANK
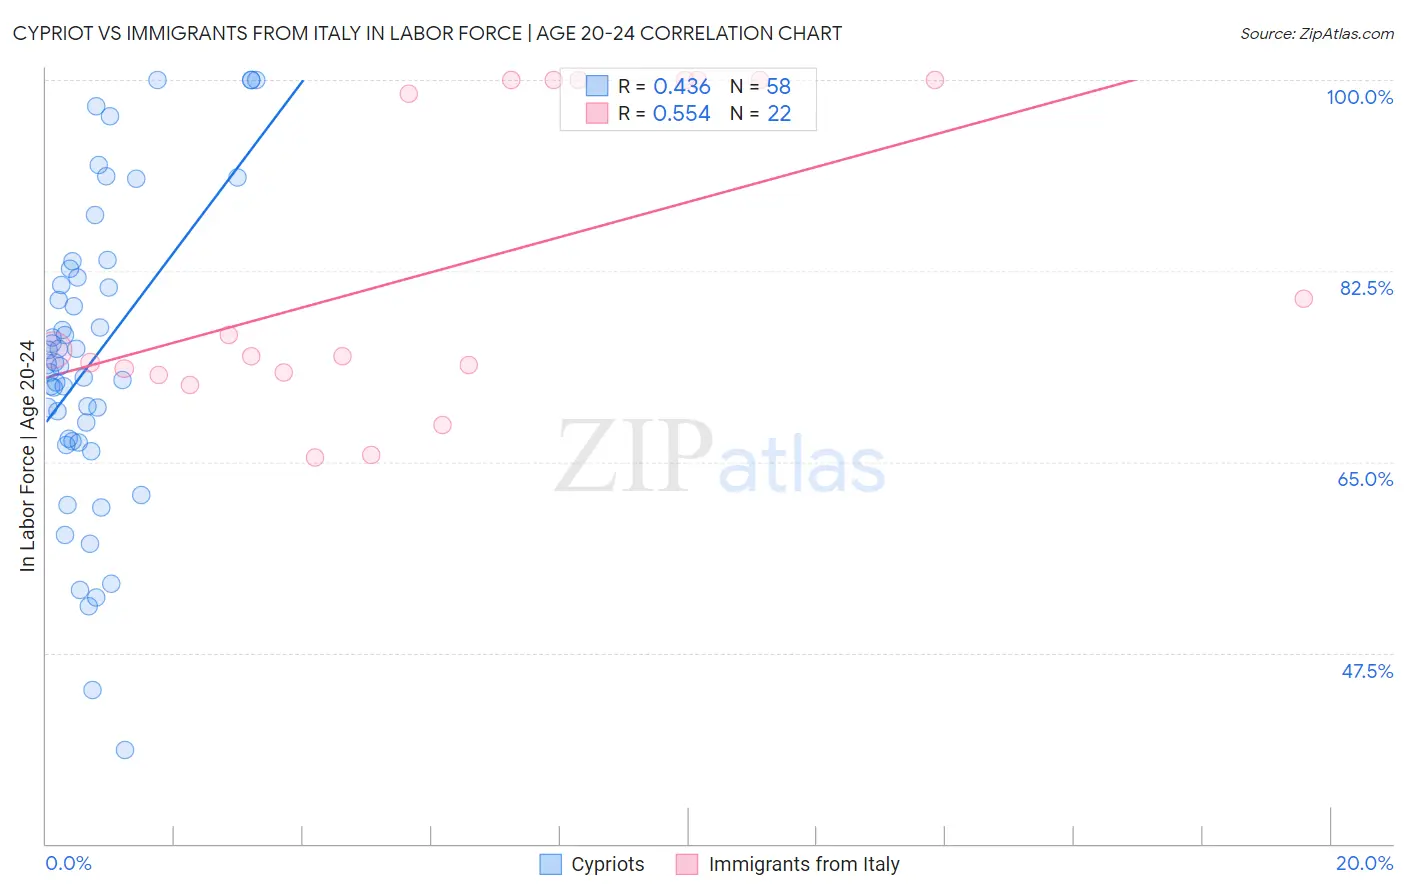
Cypriot vs Immigrants from Italy In Labor Force | Age 20-24 Correlation Chart
The statistical analysis conducted on geographies consisting of 61,866,486 people shows a moderate positive correlation between the proportion of Cypriots and labor force participation rate among population between the ages 20 and 24 in the United States with a correlation coefficient (R) of 0.436 and weighted average of 73.3%. Similarly, the statistical analysis conducted on geographies consisting of 324,060,092 people shows a substantial positive correlation between the proportion of Immigrants from Italy and labor force participation rate among population between the ages 20 and 24 in the United States with a correlation coefficient (R) of 0.554 and weighted average of 74.6%, a difference of 1.8%.
In Labor Force | Age 20-24 Correlation Summary
| Measurement | Cypriot | Immigrants from Italy |
| Minimum | 38.6% | 65.4% |
| Maximum | 100.0% | 100.0% |
| Range | 61.4% | 34.6% |
| Mean | 74.4% | 82.7% |
| Median | 73.9% | 75.0% |
| Interquartile 25% (IQ1) | 66.9% | 73.2% |
| Interquartile 75% (IQ3) | 81.9% | 100.0% |
| Interquartile Range (IQR) | 15.0% | 26.8% |
| Standard Deviation (Sample) | 13.9% | 13.6% |
| Standard Deviation (Population) | 13.8% | 13.3% |
Similar Demographics by In Labor Force | Age 20-24
Demographics Similar to Cypriots by In Labor Force | Age 20-24
In terms of in labor force | age 20-24, the demographic groups most similar to Cypriots are Venezuelan (73.3%, a difference of 0.010%), Immigrants from Malaysia (73.3%, a difference of 0.020%), Mongolian (73.3%, a difference of 0.030%), Immigrants from South America (73.3%, a difference of 0.040%), and Bahamian (73.3%, a difference of 0.080%).
| Demographics | Rating | Rank | In Labor Force | Age 20-24 |
| Immigrants | Indonesia | 0.3 /100 | #271 | Tragic 73.4% |
| Belizeans | 0.3 /100 | #272 | Tragic 73.4% |
| Cheyenne | 0.2 /100 | #273 | Tragic 73.4% |
| Immigrants | Colombia | 0.2 /100 | #274 | Tragic 73.4% |
| Immigrants | South America | 0.2 /100 | #275 | Tragic 73.3% |
| Mongolians | 0.2 /100 | #276 | Tragic 73.3% |
| Immigrants | Malaysia | 0.2 /100 | #277 | Tragic 73.3% |
| Cypriots | 0.2 /100 | #278 | Tragic 73.3% |
| Venezuelans | 0.2 /100 | #279 | Tragic 73.3% |
| Bahamians | 0.1 /100 | #280 | Tragic 73.3% |
| Immigrants | Venezuela | 0.1 /100 | #281 | Tragic 73.2% |
| Immigrants | Spain | 0.1 /100 | #282 | Tragic 73.2% |
| Immigrants | Bahamas | 0.1 /100 | #283 | Tragic 73.2% |
| Kiowa | 0.1 /100 | #284 | Tragic 73.2% |
| Nicaraguans | 0.1 /100 | #285 | Tragic 73.2% |
Demographics Similar to Immigrants from Italy by In Labor Force | Age 20-24
In terms of in labor force | age 20-24, the demographic groups most similar to Immigrants from Italy are Inupiat (74.6%, a difference of 0.0%), Sioux (74.6%, a difference of 0.0%), Immigrants from Northern Africa (74.6%, a difference of 0.010%), Albanian (74.6%, a difference of 0.040%), and Immigrants from Uruguay (74.6%, a difference of 0.050%).
| Demographics | Rating | Rank | In Labor Force | Age 20-24 |
| Panamanians | 25.0 /100 | #197 | Fair 74.7% |
| Immigrants | Nigeria | 24.2 /100 | #198 | Fair 74.7% |
| Taiwanese | 23.2 /100 | #199 | Fair 74.7% |
| Nigerians | 21.9 /100 | #200 | Fair 74.7% |
| Choctaw | 21.4 /100 | #201 | Fair 74.7% |
| Moroccans | 20.4 /100 | #202 | Fair 74.7% |
| Immigrants | Northern Africa | 17.9 /100 | #203 | Poor 74.6% |
| Immigrants | Italy | 17.6 /100 | #204 | Poor 74.6% |
| Inupiat | 17.6 /100 | #205 | Poor 74.6% |
| Sioux | 17.5 /100 | #206 | Poor 74.6% |
| Albanians | 16.2 /100 | #207 | Poor 74.6% |
| Immigrants | Uruguay | 15.8 /100 | #208 | Poor 74.6% |
| Arabs | 15.8 /100 | #209 | Poor 74.6% |
| Uruguayans | 15.1 /100 | #210 | Poor 74.6% |
| Immigrants | Australia | 14.7 /100 | #211 | Poor 74.6% |