Cypriot vs Central American In Labor Force | Age 20-24
COMPARE
Cypriot
Central American
In Labor Force | Age 20-24
In Labor Force | Age 20-24 Comparison
Cypriots
Central Americans
73.3%
IN LABOR FORCE | AGE 20-24
0.2/ 100
METRIC RATING
278th/ 347
METRIC RANK
75.0%
IN LABOR FORCE | AGE 20-24
48.7/ 100
METRIC RATING
176th/ 347
METRIC RANK
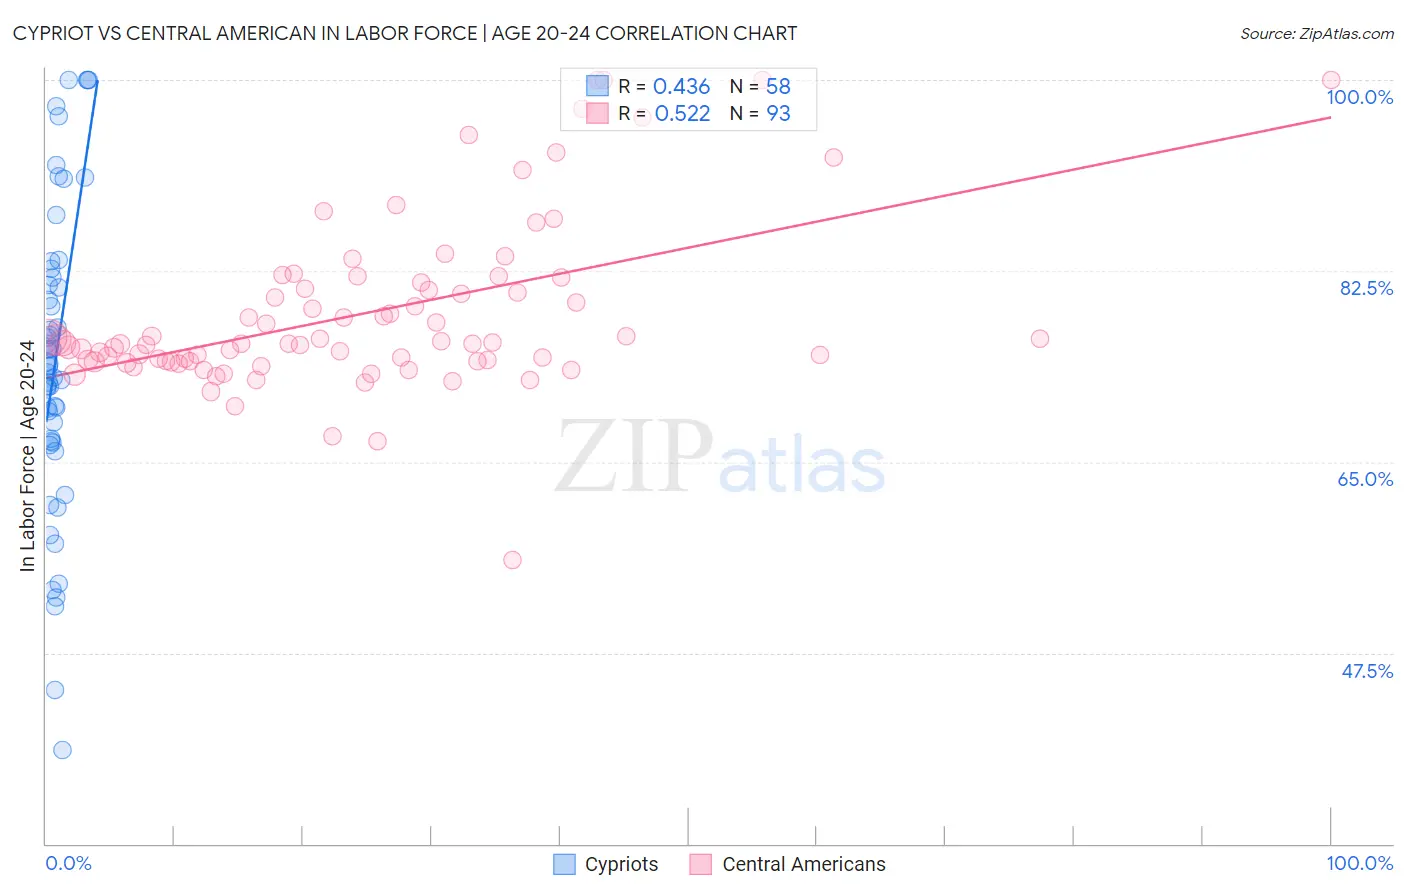
Cypriot vs Central American In Labor Force | Age 20-24 Correlation Chart
The statistical analysis conducted on geographies consisting of 61,866,486 people shows a moderate positive correlation between the proportion of Cypriots and labor force participation rate among population between the ages 20 and 24 in the United States with a correlation coefficient (R) of 0.436 and weighted average of 73.3%. Similarly, the statistical analysis conducted on geographies consisting of 504,332,893 people shows a substantial positive correlation between the proportion of Central Americans and labor force participation rate among population between the ages 20 and 24 in the United States with a correlation coefficient (R) of 0.522 and weighted average of 75.0%, a difference of 2.4%.
In Labor Force | Age 20-24 Correlation Summary
| Measurement | Cypriot | Central American |
| Minimum | 38.6% | 56.0% |
| Maximum | 100.0% | 100.0% |
| Range | 61.4% | 44.0% |
| Mean | 74.4% | 78.6% |
| Median | 73.9% | 75.8% |
| Interquartile 25% (IQ1) | 66.9% | 74.2% |
| Interquartile 75% (IQ3) | 81.9% | 81.1% |
| Interquartile Range (IQR) | 15.0% | 6.9% |
| Standard Deviation (Sample) | 13.9% | 7.8% |
| Standard Deviation (Population) | 13.8% | 7.8% |
Similar Demographics by In Labor Force | Age 20-24
Demographics Similar to Cypriots by In Labor Force | Age 20-24
In terms of in labor force | age 20-24, the demographic groups most similar to Cypriots are Venezuelan (73.3%, a difference of 0.010%), Immigrants from Malaysia (73.3%, a difference of 0.020%), Mongolian (73.3%, a difference of 0.030%), Immigrants from South America (73.3%, a difference of 0.040%), and Bahamian (73.3%, a difference of 0.080%).
| Demographics | Rating | Rank | In Labor Force | Age 20-24 |
| Immigrants | Indonesia | 0.3 /100 | #271 | Tragic 73.4% |
| Belizeans | 0.3 /100 | #272 | Tragic 73.4% |
| Cheyenne | 0.2 /100 | #273 | Tragic 73.4% |
| Immigrants | Colombia | 0.2 /100 | #274 | Tragic 73.4% |
| Immigrants | South America | 0.2 /100 | #275 | Tragic 73.3% |
| Mongolians | 0.2 /100 | #276 | Tragic 73.3% |
| Immigrants | Malaysia | 0.2 /100 | #277 | Tragic 73.3% |
| Cypriots | 0.2 /100 | #278 | Tragic 73.3% |
| Venezuelans | 0.2 /100 | #279 | Tragic 73.3% |
| Bahamians | 0.1 /100 | #280 | Tragic 73.3% |
| Immigrants | Venezuela | 0.1 /100 | #281 | Tragic 73.2% |
| Immigrants | Spain | 0.1 /100 | #282 | Tragic 73.2% |
| Immigrants | Bahamas | 0.1 /100 | #283 | Tragic 73.2% |
| Kiowa | 0.1 /100 | #284 | Tragic 73.2% |
| Nicaraguans | 0.1 /100 | #285 | Tragic 73.2% |
Demographics Similar to Central Americans by In Labor Force | Age 20-24
In terms of in labor force | age 20-24, the demographic groups most similar to Central Americans are Syrian (75.0%, a difference of 0.010%), Immigrants from Mexico (75.0%, a difference of 0.010%), Immigrants from Croatia (75.1%, a difference of 0.020%), South African (75.0%, a difference of 0.020%), and Yakama (75.1%, a difference of 0.030%).
| Demographics | Rating | Rank | In Labor Force | Age 20-24 |
| Immigrants | Philippines | 55.8 /100 | #169 | Average 75.1% |
| Mexicans | 52.1 /100 | #170 | Average 75.1% |
| Cajuns | 51.1 /100 | #171 | Average 75.1% |
| Yakama | 50.8 /100 | #172 | Average 75.1% |
| Immigrants | Croatia | 50.2 /100 | #173 | Average 75.1% |
| South Africans | 50.0 /100 | #174 | Average 75.0% |
| Syrians | 49.5 /100 | #175 | Average 75.0% |
| Central Americans | 48.7 /100 | #176 | Average 75.0% |
| Immigrants | Mexico | 47.8 /100 | #177 | Average 75.0% |
| Immigrants | Central America | 45.0 /100 | #178 | Average 75.0% |
| Immigrants | Latvia | 44.1 /100 | #179 | Average 75.0% |
| Immigrants | Czechoslovakia | 44.0 /100 | #180 | Average 75.0% |
| Africans | 42.5 /100 | #181 | Average 75.0% |
| Immigrants | South Africa | 36.9 /100 | #182 | Fair 74.9% |
| Immigrants | Costa Rica | 36.7 /100 | #183 | Fair 74.9% |