Cypriot vs Immigrants from England In Labor Force | Age 20-24
COMPARE
Cypriot
Immigrants from England
In Labor Force | Age 20-24
In Labor Force | Age 20-24 Comparison
Cypriots
Immigrants from England
73.3%
IN LABOR FORCE | AGE 20-24
0.2/ 100
METRIC RATING
278th/ 347
METRIC RANK
75.5%
IN LABOR FORCE | AGE 20-24
84.6/ 100
METRIC RATING
139th/ 347
METRIC RANK
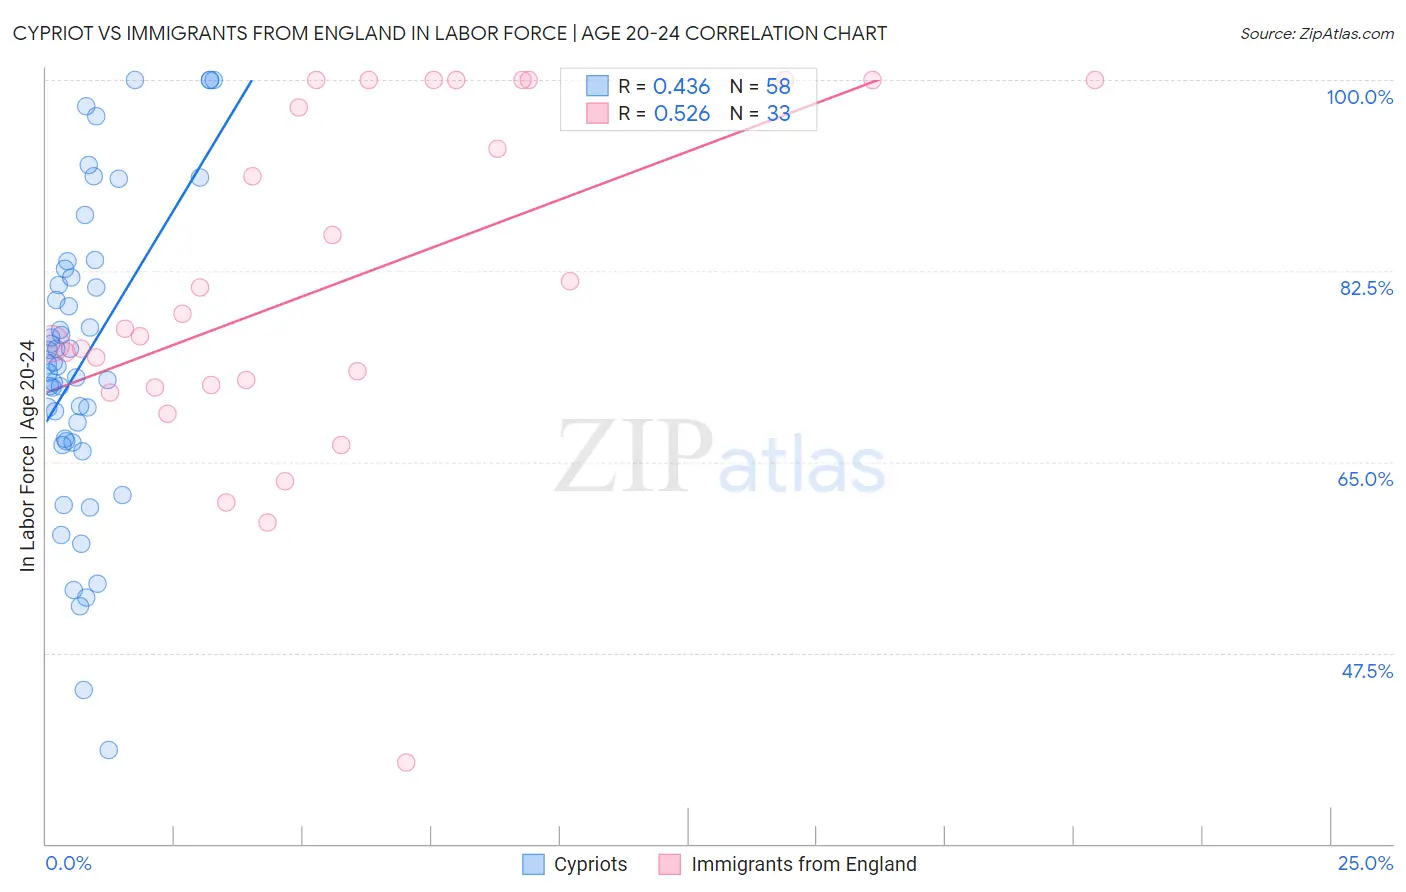
Cypriot vs Immigrants from England In Labor Force | Age 20-24 Correlation Chart
The statistical analysis conducted on geographies consisting of 61,866,486 people shows a moderate positive correlation between the proportion of Cypriots and labor force participation rate among population between the ages 20 and 24 in the United States with a correlation coefficient (R) of 0.436 and weighted average of 73.3%. Similarly, the statistical analysis conducted on geographies consisting of 391,654,544 people shows a substantial positive correlation between the proportion of Immigrants from England and labor force participation rate among population between the ages 20 and 24 in the United States with a correlation coefficient (R) of 0.526 and weighted average of 75.5%, a difference of 3.0%.
In Labor Force | Age 20-24 Correlation Summary
| Measurement | Cypriot | Immigrants from England |
| Minimum | 38.6% | 37.5% |
| Maximum | 100.0% | 100.0% |
| Range | 61.4% | 62.5% |
| Mean | 74.4% | 81.3% |
| Median | 73.9% | 77.2% |
| Interquartile 25% (IQ1) | 66.9% | 71.9% |
| Interquartile 75% (IQ3) | 81.9% | 100.0% |
| Interquartile Range (IQR) | 15.0% | 28.1% |
| Standard Deviation (Sample) | 13.9% | 15.6% |
| Standard Deviation (Population) | 13.8% | 15.4% |
Similar Demographics by In Labor Force | Age 20-24
Demographics Similar to Cypriots by In Labor Force | Age 20-24
In terms of in labor force | age 20-24, the demographic groups most similar to Cypriots are Venezuelan (73.3%, a difference of 0.010%), Immigrants from Malaysia (73.3%, a difference of 0.020%), Mongolian (73.3%, a difference of 0.030%), Immigrants from South America (73.3%, a difference of 0.040%), and Bahamian (73.3%, a difference of 0.080%).
| Demographics | Rating | Rank | In Labor Force | Age 20-24 |
| Immigrants | Indonesia | 0.3 /100 | #271 | Tragic 73.4% |
| Belizeans | 0.3 /100 | #272 | Tragic 73.4% |
| Cheyenne | 0.2 /100 | #273 | Tragic 73.4% |
| Immigrants | Colombia | 0.2 /100 | #274 | Tragic 73.4% |
| Immigrants | South America | 0.2 /100 | #275 | Tragic 73.3% |
| Mongolians | 0.2 /100 | #276 | Tragic 73.3% |
| Immigrants | Malaysia | 0.2 /100 | #277 | Tragic 73.3% |
| Cypriots | 0.2 /100 | #278 | Tragic 73.3% |
| Venezuelans | 0.2 /100 | #279 | Tragic 73.3% |
| Bahamians | 0.1 /100 | #280 | Tragic 73.3% |
| Immigrants | Venezuela | 0.1 /100 | #281 | Tragic 73.2% |
| Immigrants | Spain | 0.1 /100 | #282 | Tragic 73.2% |
| Immigrants | Bahamas | 0.1 /100 | #283 | Tragic 73.2% |
| Kiowa | 0.1 /100 | #284 | Tragic 73.2% |
| Nicaraguans | 0.1 /100 | #285 | Tragic 73.2% |
Demographics Similar to Immigrants from England by In Labor Force | Age 20-24
In terms of in labor force | age 20-24, the demographic groups most similar to Immigrants from England are Delaware (75.5%, a difference of 0.0%), Immigrants from Brazil (75.5%, a difference of 0.010%), Jordanian (75.5%, a difference of 0.010%), Australian (75.5%, a difference of 0.010%), and Romanian (75.5%, a difference of 0.010%).
| Demographics | Rating | Rank | In Labor Force | Age 20-24 |
| Palestinians | 88.4 /100 | #132 | Excellent 75.6% |
| Zimbabweans | 88.2 /100 | #133 | Excellent 75.6% |
| Estonians | 87.1 /100 | #134 | Excellent 75.6% |
| Yaqui | 85.5 /100 | #135 | Excellent 75.5% |
| Immigrants | Brazil | 84.8 /100 | #136 | Excellent 75.5% |
| Jordanians | 84.8 /100 | #137 | Excellent 75.5% |
| Australians | 84.8 /100 | #138 | Excellent 75.5% |
| Immigrants | England | 84.6 /100 | #139 | Excellent 75.5% |
| Delaware | 84.5 /100 | #140 | Excellent 75.5% |
| Romanians | 84.1 /100 | #141 | Excellent 75.5% |
| Blackfeet | 83.6 /100 | #142 | Excellent 75.5% |
| Spaniards | 82.0 /100 | #143 | Excellent 75.5% |
| Bhutanese | 80.8 /100 | #144 | Excellent 75.4% |
| Koreans | 79.7 /100 | #145 | Good 75.4% |
| Mexican American Indians | 78.8 /100 | #146 | Good 75.4% |