Cypriot vs Immigrants from Greece In Labor Force | Age 45-54
COMPARE
Cypriot
Immigrants from Greece
In Labor Force | Age 45-54
In Labor Force | Age 45-54 Comparison
Cypriots
Immigrants from Greece
84.1%
IN LABOR FORCE | AGE 45-54
99.9/ 100
METRIC RATING
15th/ 347
METRIC RANK
83.6%
IN LABOR FORCE | AGE 45-54
98.8/ 100
METRIC RATING
50th/ 347
METRIC RANK
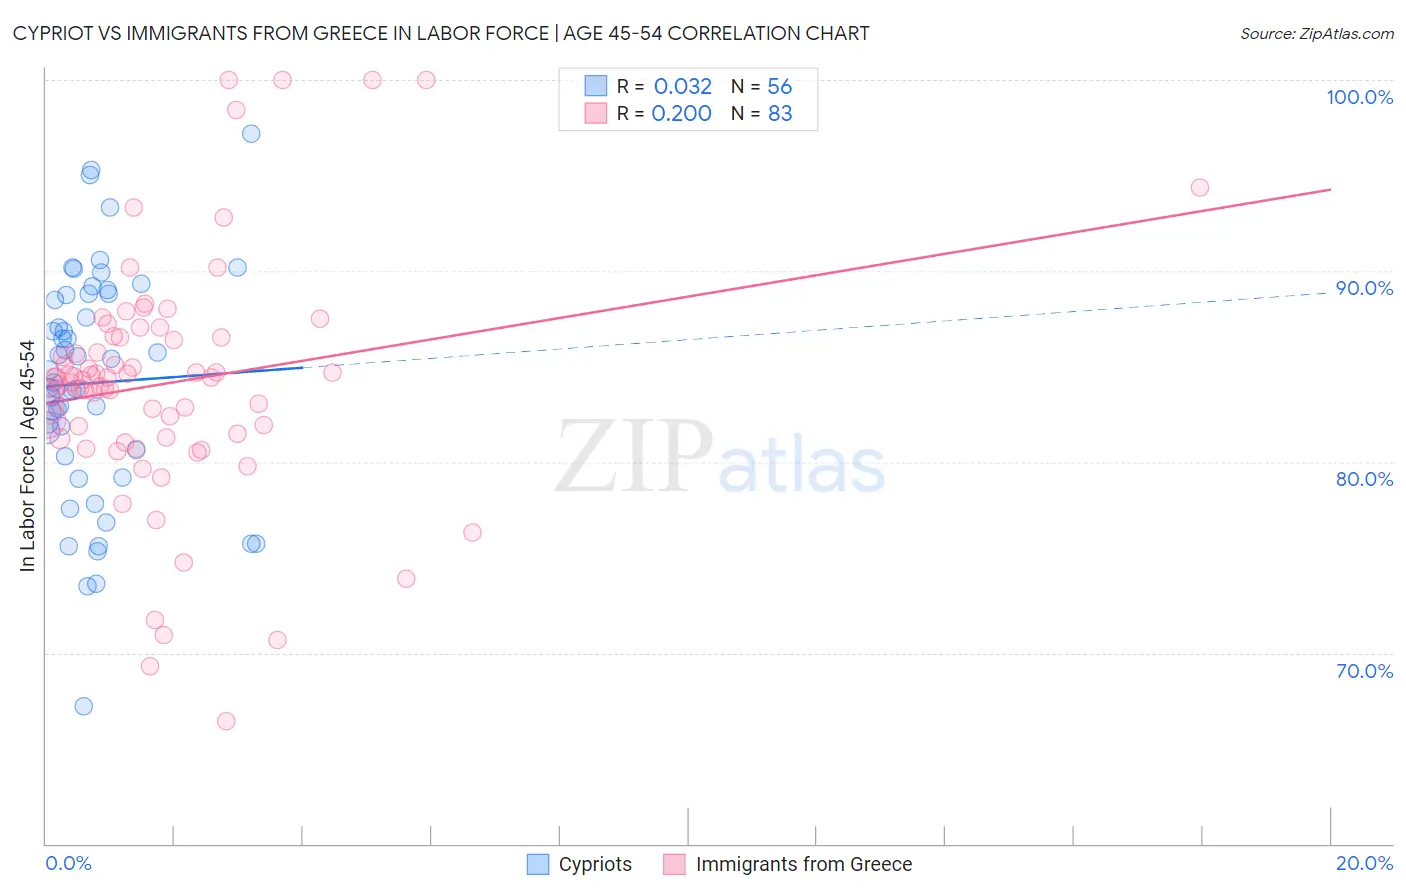
Cypriot vs Immigrants from Greece In Labor Force | Age 45-54 Correlation Chart
The statistical analysis conducted on geographies consisting of 61,850,657 people shows no correlation between the proportion of Cypriots and labor force participation rate among population between the ages 45 and 54 in the United States with a correlation coefficient (R) of 0.032 and weighted average of 84.1%. Similarly, the statistical analysis conducted on geographies consisting of 216,863,996 people shows a weak positive correlation between the proportion of Immigrants from Greece and labor force participation rate among population between the ages 45 and 54 in the United States with a correlation coefficient (R) of 0.200 and weighted average of 83.6%, a difference of 0.60%.
In Labor Force | Age 45-54 Correlation Summary
| Measurement | Cypriot | Immigrants from Greece |
| Minimum | 67.2% | 66.4% |
| Maximum | 97.2% | 100.0% |
| Range | 30.0% | 33.6% |
| Mean | 84.1% | 84.1% |
| Median | 84.5% | 84.3% |
| Interquartile 25% (IQ1) | 80.5% | 81.3% |
| Interquartile 75% (IQ3) | 88.8% | 86.5% |
| Interquartile Range (IQR) | 8.3% | 5.2% |
| Standard Deviation (Sample) | 6.0% | 6.3% |
| Standard Deviation (Population) | 6.0% | 6.3% |
Similar Demographics by In Labor Force | Age 45-54
Demographics Similar to Cypriots by In Labor Force | Age 45-54
In terms of in labor force | age 45-54, the demographic groups most similar to Cypriots are Immigrants from Nepal (84.0%, a difference of 0.020%), Zimbabwean (84.0%, a difference of 0.040%), Immigrants from South Central Asia (84.0%, a difference of 0.040%), Cambodian (84.1%, a difference of 0.060%), and Chinese (84.1%, a difference of 0.090%).
| Demographics | Rating | Rank | In Labor Force | Age 45-54 |
| Sierra Leoneans | 100.0 /100 | #8 | Exceptional 84.5% |
| Immigrants | Sierra Leone | 100.0 /100 | #9 | Exceptional 84.4% |
| Norwegians | 100.0 /100 | #10 | Exceptional 84.4% |
| Thais | 100.0 /100 | #11 | Exceptional 84.3% |
| Bulgarians | 100.0 /100 | #12 | Exceptional 84.2% |
| Chinese | 99.9 /100 | #13 | Exceptional 84.1% |
| Cambodians | 99.9 /100 | #14 | Exceptional 84.1% |
| Cypriots | 99.9 /100 | #15 | Exceptional 84.1% |
| Immigrants | Nepal | 99.9 /100 | #16 | Exceptional 84.0% |
| Zimbabweans | 99.9 /100 | #17 | Exceptional 84.0% |
| Immigrants | South Central Asia | 99.9 /100 | #18 | Exceptional 84.0% |
| Czechs | 99.8 /100 | #19 | Exceptional 83.9% |
| Immigrants | Eastern Africa | 99.8 /100 | #20 | Exceptional 83.9% |
| Immigrants | Sri Lanka | 99.8 /100 | #21 | Exceptional 83.9% |
| Immigrants | Ireland | 99.8 /100 | #22 | Exceptional 83.9% |
Demographics Similar to Immigrants from Greece by In Labor Force | Age 45-54
In terms of in labor force | age 45-54, the demographic groups most similar to Immigrants from Greece are Immigrants from Turkey (83.6%, a difference of 0.010%), Polish (83.6%, a difference of 0.010%), Peruvian (83.6%, a difference of 0.010%), Somali (83.5%, a difference of 0.020%), and Macedonian (83.5%, a difference of 0.020%).
| Demographics | Rating | Rank | In Labor Force | Age 45-54 |
| Venezuelans | 99.2 /100 | #43 | Exceptional 83.6% |
| Burmese | 99.1 /100 | #44 | Exceptional 83.6% |
| Immigrants | Hong Kong | 99.1 /100 | #45 | Exceptional 83.6% |
| Lithuanians | 99.1 /100 | #46 | Exceptional 83.6% |
| Croatians | 99.0 /100 | #47 | Exceptional 83.6% |
| Immigrants | Poland | 99.0 /100 | #48 | Exceptional 83.6% |
| Immigrants | Morocco | 99.0 /100 | #49 | Exceptional 83.6% |
| Immigrants | Greece | 98.8 /100 | #50 | Exceptional 83.6% |
| Immigrants | Turkey | 98.8 /100 | #51 | Exceptional 83.6% |
| Poles | 98.7 /100 | #52 | Exceptional 83.6% |
| Peruvians | 98.7 /100 | #53 | Exceptional 83.6% |
| Somalis | 98.7 /100 | #54 | Exceptional 83.5% |
| Macedonians | 98.7 /100 | #55 | Exceptional 83.5% |
| Immigrants | Peru | 98.6 /100 | #56 | Exceptional 83.5% |
| Paraguayans | 98.5 /100 | #57 | Exceptional 83.5% |