Cypriot vs Immigrants from Greece College, Under 1 year
COMPARE
Cypriot
Immigrants from Greece
College, Under 1 year
College, Under 1 year Comparison
Cypriots
Immigrants from Greece
72.0%
COLLEGE, UNDER 1 YEAR
100.0/ 100
METRIC RATING
13th/ 347
METRIC RANK
68.4%
COLLEGE, UNDER 1 YEAR
98.5/ 100
METRIC RATING
81st/ 347
METRIC RANK
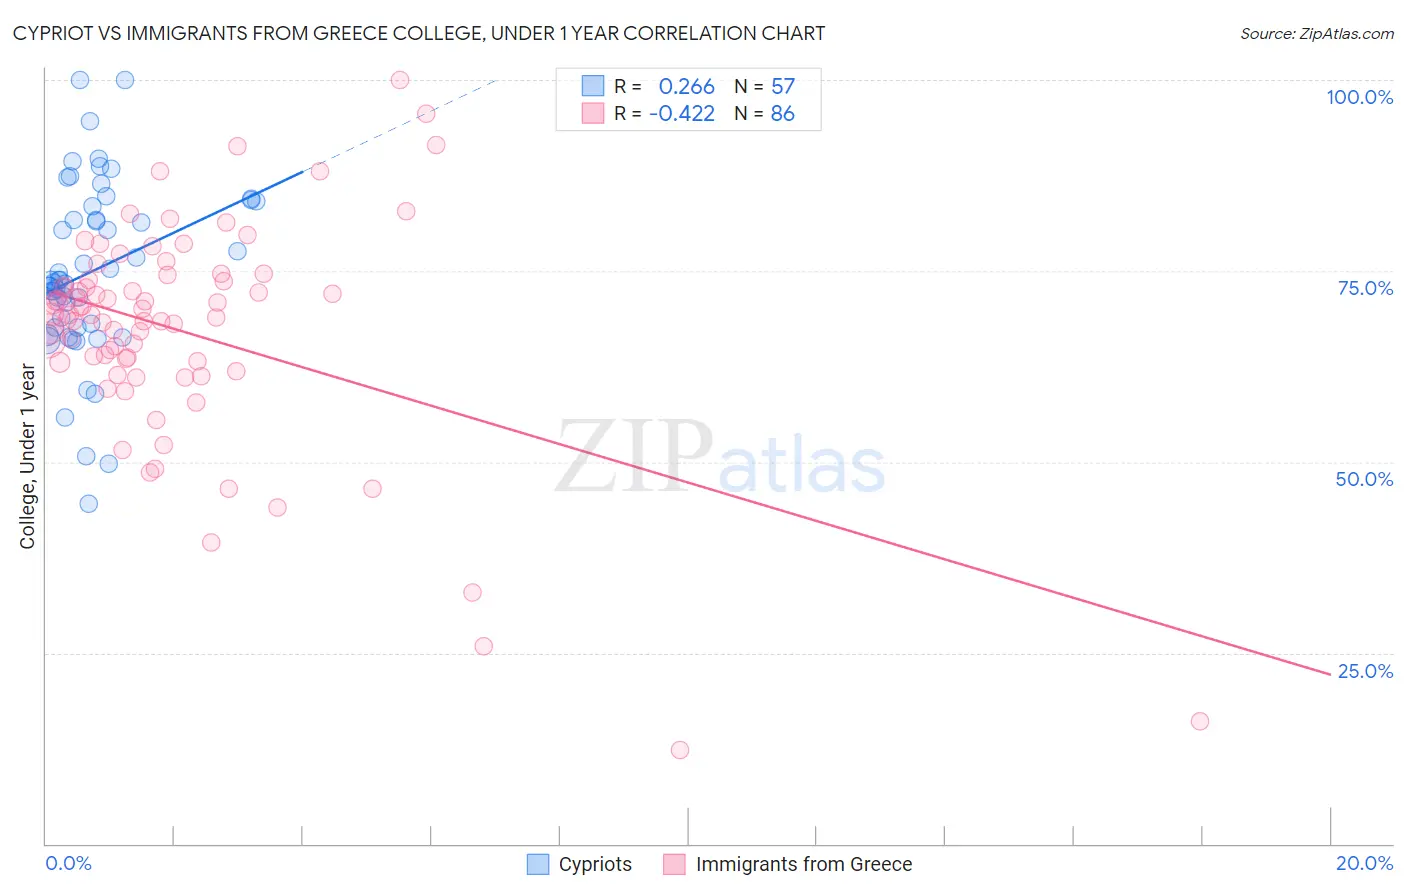
Cypriot vs Immigrants from Greece College, Under 1 year Correlation Chart
The statistical analysis conducted on geographies consisting of 61,870,289 people shows a weak positive correlation between the proportion of Cypriots and percentage of population with at least college, under 1 year education in the United States with a correlation coefficient (R) of 0.266 and weighted average of 72.0%. Similarly, the statistical analysis conducted on geographies consisting of 216,879,519 people shows a moderate negative correlation between the proportion of Immigrants from Greece and percentage of population with at least college, under 1 year education in the United States with a correlation coefficient (R) of -0.422 and weighted average of 68.4%, a difference of 5.2%.
College, Under 1 year Correlation Summary
| Measurement | Cypriot | Immigrants from Greece |
| Minimum | 44.5% | 12.4% |
| Maximum | 100.0% | 100.0% |
| Range | 55.5% | 87.6% |
| Mean | 74.9% | 67.1% |
| Median | 73.8% | 69.3% |
| Interquartile 25% (IQ1) | 67.6% | 63.1% |
| Interquartile 75% (IQ3) | 83.8% | 73.8% |
| Interquartile Range (IQR) | 16.2% | 10.7% |
| Standard Deviation (Sample) | 11.5% | 14.9% |
| Standard Deviation (Population) | 11.4% | 14.8% |
Similar Demographics by College, Under 1 year
Demographics Similar to Cypriots by College, Under 1 year
In terms of college, under 1 year, the demographic groups most similar to Cypriots are Cambodian (71.9%, a difference of 0.12%), Burmese (71.9%, a difference of 0.12%), Immigrants from Japan (71.9%, a difference of 0.13%), Immigrants from South Central Asia (72.1%, a difference of 0.16%), and Immigrants from Sweden (72.1%, a difference of 0.16%).
| Demographics | Rating | Rank | College, Under 1 year |
| Immigrants | Taiwan | 100.0 /100 | #6 | Exceptional 74.2% |
| Okinawans | 100.0 /100 | #7 | Exceptional 73.7% |
| Thais | 100.0 /100 | #8 | Exceptional 73.4% |
| Immigrants | Australia | 100.0 /100 | #9 | Exceptional 72.7% |
| Immigrants | Israel | 100.0 /100 | #10 | Exceptional 72.3% |
| Immigrants | South Central Asia | 100.0 /100 | #11 | Exceptional 72.1% |
| Immigrants | Sweden | 100.0 /100 | #12 | Exceptional 72.1% |
| Cypriots | 100.0 /100 | #13 | Exceptional 72.0% |
| Cambodians | 100.0 /100 | #14 | Exceptional 71.9% |
| Burmese | 100.0 /100 | #15 | Exceptional 71.9% |
| Immigrants | Japan | 100.0 /100 | #16 | Exceptional 71.9% |
| Eastern Europeans | 100.0 /100 | #17 | Exceptional 71.8% |
| Immigrants | Switzerland | 100.0 /100 | #18 | Exceptional 71.7% |
| Latvians | 100.0 /100 | #19 | Exceptional 71.6% |
| Immigrants | Korea | 100.0 /100 | #20 | Exceptional 71.6% |
Demographics Similar to Immigrants from Greece by College, Under 1 year
In terms of college, under 1 year, the demographic groups most similar to Immigrants from Greece are Immigrants from Spain (68.4%, a difference of 0.040%), Norwegian (68.4%, a difference of 0.050%), Greek (68.5%, a difference of 0.070%), Argentinean (68.4%, a difference of 0.070%), and Danish (68.5%, a difference of 0.080%).
| Demographics | Rating | Rank | College, Under 1 year |
| Swedes | 98.9 /100 | #74 | Exceptional 68.7% |
| Immigrants | Western Europe | 98.6 /100 | #75 | Exceptional 68.5% |
| Laotians | 98.6 /100 | #76 | Exceptional 68.5% |
| British | 98.6 /100 | #77 | Exceptional 68.5% |
| Danes | 98.6 /100 | #78 | Exceptional 68.5% |
| Greeks | 98.6 /100 | #79 | Exceptional 68.5% |
| Immigrants | Spain | 98.5 /100 | #80 | Exceptional 68.4% |
| Immigrants | Greece | 98.5 /100 | #81 | Exceptional 68.4% |
| Norwegians | 98.4 /100 | #82 | Exceptional 68.4% |
| Argentineans | 98.4 /100 | #83 | Exceptional 68.4% |
| Immigrants | Hungary | 98.3 /100 | #84 | Exceptional 68.3% |
| Egyptians | 98.3 /100 | #85 | Exceptional 68.3% |
| Immigrants | Lebanon | 98.3 /100 | #86 | Exceptional 68.3% |
| Chinese | 98.3 /100 | #87 | Exceptional 68.3% |
| Croatians | 98.2 /100 | #88 | Exceptional 68.3% |