Cypriot vs Ukrainian In Labor Force | Age 35-44
COMPARE
Cypriot
Ukrainian
In Labor Force | Age 35-44
In Labor Force | Age 35-44 Comparison
Cypriots
Ukrainians
85.2%
IN LABOR FORCE | AGE 35-44
99.8/ 100
METRIC RATING
45th/ 347
METRIC RANK
84.7%
IN LABOR FORCE | AGE 35-44
93.5/ 100
METRIC RATING
111th/ 347
METRIC RANK
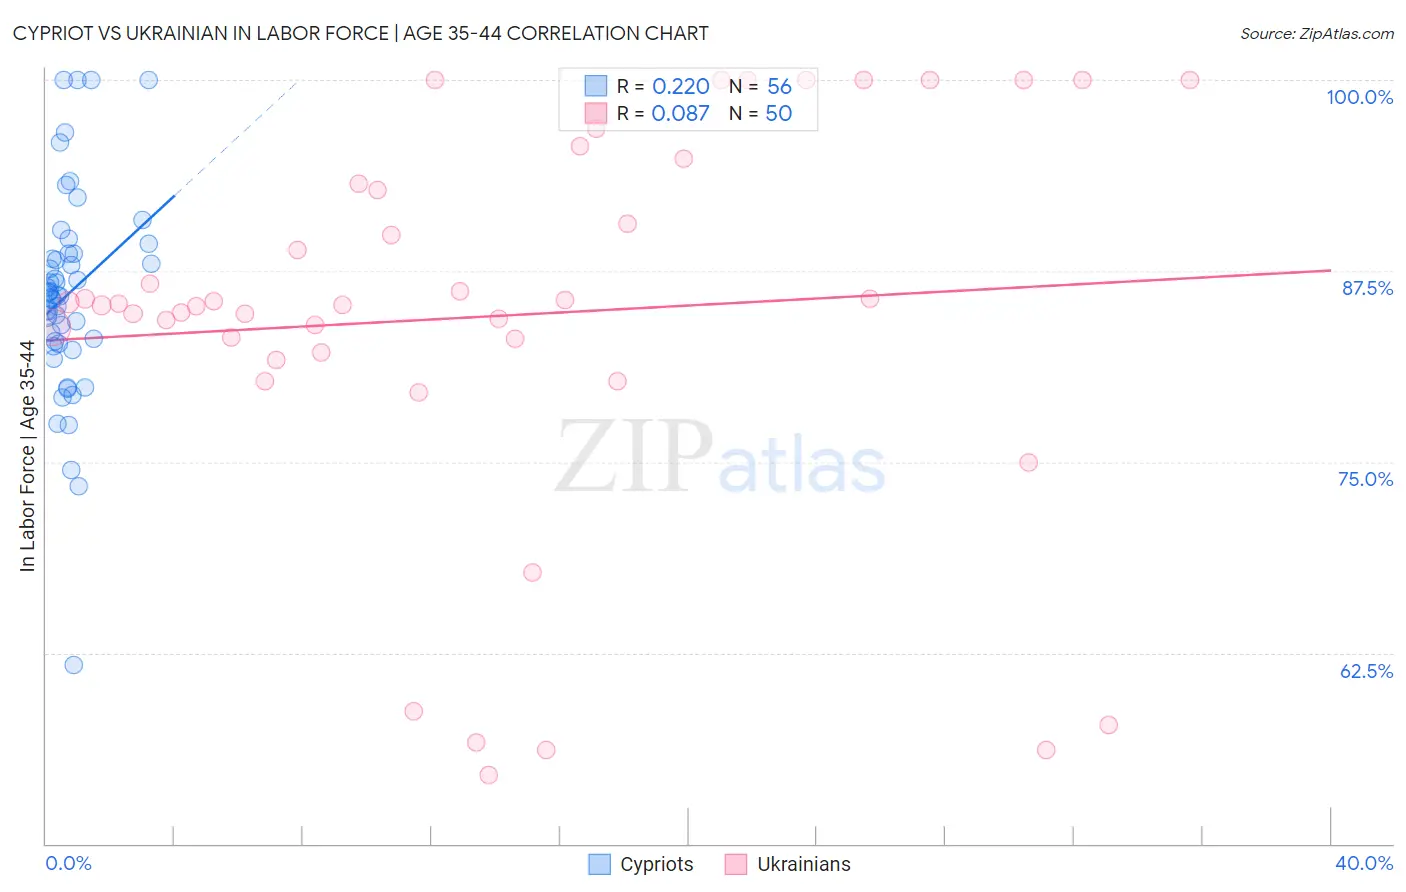
Cypriot vs Ukrainian In Labor Force | Age 35-44 Correlation Chart
The statistical analysis conducted on geographies consisting of 61,851,506 people shows a weak positive correlation between the proportion of Cypriots and labor force participation rate among population between the ages 35 and 44 in the United States with a correlation coefficient (R) of 0.220 and weighted average of 85.2%. Similarly, the statistical analysis conducted on geographies consisting of 448,358,650 people shows a slight positive correlation between the proportion of Ukrainians and labor force participation rate among population between the ages 35 and 44 in the United States with a correlation coefficient (R) of 0.087 and weighted average of 84.7%, a difference of 0.55%.
In Labor Force | Age 35-44 Correlation Summary
| Measurement | Cypriot | Ukrainian |
| Minimum | 61.7% | 54.5% |
| Maximum | 100.0% | 100.0% |
| Range | 38.3% | 45.5% |
| Mean | 86.0% | 84.6% |
| Median | 86.0% | 85.3% |
| Interquartile 25% (IQ1) | 82.8% | 82.1% |
| Interquartile 75% (IQ3) | 88.6% | 93.2% |
| Interquartile Range (IQR) | 5.8% | 11.0% |
| Standard Deviation (Sample) | 6.8% | 12.7% |
| Standard Deviation (Population) | 6.8% | 12.6% |
Similar Demographics by In Labor Force | Age 35-44
Demographics Similar to Cypriots by In Labor Force | Age 35-44
In terms of in labor force | age 35-44, the demographic groups most similar to Cypriots are Immigrants from Hong Kong (85.2%, a difference of 0.0%), Lithuanian (85.2%, a difference of 0.010%), German Russian (85.2%, a difference of 0.010%), Immigrants from Zimbabwe (85.2%, a difference of 0.020%), and Macedonian (85.2%, a difference of 0.020%).
| Demographics | Rating | Rank | In Labor Force | Age 35-44 |
| Immigrants | Poland | 99.8 /100 | #38 | Exceptional 85.2% |
| Eastern Europeans | 99.8 /100 | #39 | Exceptional 85.2% |
| Immigrants | Bulgaria | 99.8 /100 | #40 | Exceptional 85.2% |
| Immigrants | Zimbabwe | 99.8 /100 | #41 | Exceptional 85.2% |
| Macedonians | 99.8 /100 | #42 | Exceptional 85.2% |
| Poles | 99.8 /100 | #43 | Exceptional 85.2% |
| Lithuanians | 99.8 /100 | #44 | Exceptional 85.2% |
| Cypriots | 99.8 /100 | #45 | Exceptional 85.2% |
| Immigrants | Hong Kong | 99.8 /100 | #46 | Exceptional 85.2% |
| German Russians | 99.8 /100 | #47 | Exceptional 85.2% |
| Immigrants | Eritrea | 99.7 /100 | #48 | Exceptional 85.2% |
| Croatians | 99.7 /100 | #49 | Exceptional 85.2% |
| Thais | 99.7 /100 | #50 | Exceptional 85.2% |
| Immigrants | Albania | 99.7 /100 | #51 | Exceptional 85.1% |
| Immigrants | Kenya | 99.6 /100 | #52 | Exceptional 85.1% |
Demographics Similar to Ukrainians by In Labor Force | Age 35-44
In terms of in labor force | age 35-44, the demographic groups most similar to Ukrainians are Immigrants from Western Africa (84.7%, a difference of 0.0%), Filipino (84.7%, a difference of 0.010%), Uruguayan (84.7%, a difference of 0.010%), Chilean (84.7%, a difference of 0.010%), and Bahamian (84.7%, a difference of 0.010%).
| Demographics | Rating | Rank | In Labor Force | Age 35-44 |
| Immigrants | Sweden | 95.2 /100 | #104 | Exceptional 84.8% |
| South Americans | 95.0 /100 | #105 | Exceptional 84.8% |
| Immigrants | Bahamas | 94.8 /100 | #106 | Exceptional 84.8% |
| Immigrants | Romania | 94.7 /100 | #107 | Exceptional 84.8% |
| Immigrants | Argentina | 94.5 /100 | #108 | Exceptional 84.8% |
| Immigrants | Russia | 94.5 /100 | #109 | Exceptional 84.8% |
| Filipinos | 93.8 /100 | #110 | Exceptional 84.7% |
| Ukrainians | 93.5 /100 | #111 | Exceptional 84.7% |
| Immigrants | Western Africa | 93.4 /100 | #112 | Exceptional 84.7% |
| Uruguayans | 93.3 /100 | #113 | Exceptional 84.7% |
| Chileans | 93.2 /100 | #114 | Exceptional 84.7% |
| Bahamians | 93.2 /100 | #115 | Exceptional 84.7% |
| Immigrants | Egypt | 92.7 /100 | #116 | Exceptional 84.7% |
| Immigrants | China | 92.3 /100 | #117 | Exceptional 84.7% |
| Immigrants | Eastern Asia | 92.1 /100 | #118 | Exceptional 84.7% |