Belgian vs Central American In Labor Force | Age 20-24
COMPARE
Belgian
Central American
In Labor Force | Age 20-24
In Labor Force | Age 20-24 Comparison
Belgians
Central Americans
77.8%
IN LABOR FORCE | AGE 20-24
100.0/ 100
METRIC RATING
28th/ 347
METRIC RANK
75.0%
IN LABOR FORCE | AGE 20-24
48.7/ 100
METRIC RATING
176th/ 347
METRIC RANK
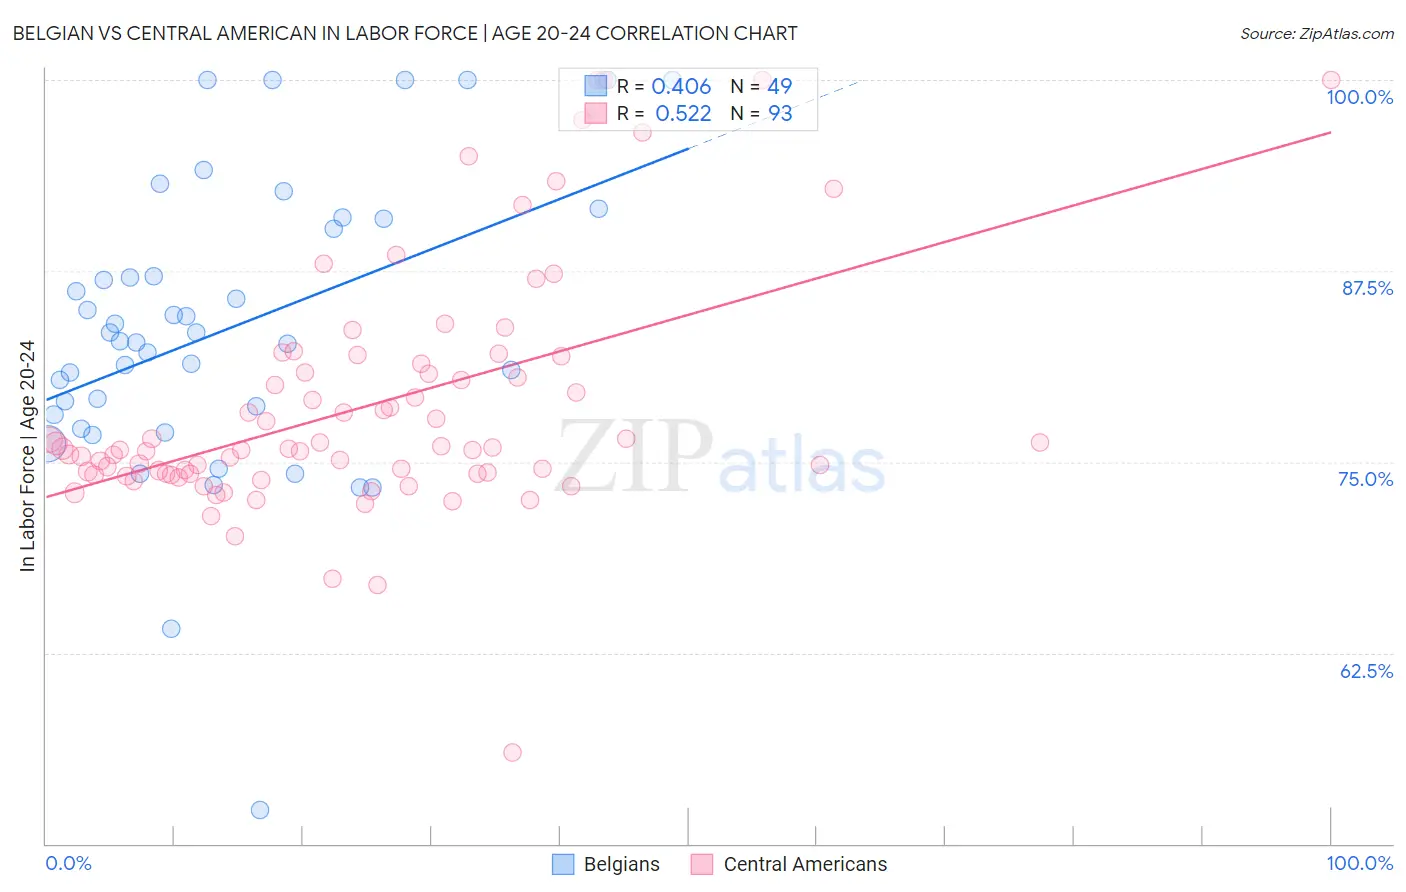
Belgian vs Central American In Labor Force | Age 20-24 Correlation Chart
The statistical analysis conducted on geographies consisting of 355,814,007 people shows a moderate positive correlation between the proportion of Belgians and labor force participation rate among population between the ages 20 and 24 in the United States with a correlation coefficient (R) of 0.406 and weighted average of 77.8%. Similarly, the statistical analysis conducted on geographies consisting of 504,332,893 people shows a substantial positive correlation between the proportion of Central Americans and labor force participation rate among population between the ages 20 and 24 in the United States with a correlation coefficient (R) of 0.522 and weighted average of 75.0%, a difference of 3.7%.
In Labor Force | Age 20-24 Correlation Summary
| Measurement | Belgian | Central American |
| Minimum | 52.2% | 56.0% |
| Maximum | 100.0% | 100.0% |
| Range | 47.8% | 44.0% |
| Mean | 83.6% | 78.6% |
| Median | 82.9% | 75.8% |
| Interquartile 25% (IQ1) | 77.6% | 74.2% |
| Interquartile 75% (IQ3) | 90.6% | 81.1% |
| Interquartile Range (IQR) | 13.0% | 6.9% |
| Standard Deviation (Sample) | 9.6% | 7.8% |
| Standard Deviation (Population) | 9.5% | 7.8% |
Similar Demographics by In Labor Force | Age 20-24
Demographics Similar to Belgians by In Labor Force | Age 20-24
In terms of in labor force | age 20-24, the demographic groups most similar to Belgians are Immigrants from Micronesia (77.8%, a difference of 0.040%), Slovak (77.7%, a difference of 0.090%), Swiss (77.7%, a difference of 0.10%), Tongan (77.9%, a difference of 0.16%), and Tlingit-Haida (77.9%, a difference of 0.18%).
| Demographics | Rating | Rank | In Labor Force | Age 20-24 |
| Puget Sound Salish | 100.0 /100 | #21 | Exceptional 78.0% |
| Pennsylvania Germans | 100.0 /100 | #22 | Exceptional 78.0% |
| Yugoslavians | 100.0 /100 | #23 | Exceptional 78.0% |
| Liberians | 100.0 /100 | #24 | Exceptional 78.0% |
| Tlingit-Haida | 100.0 /100 | #25 | Exceptional 77.9% |
| Tongans | 100.0 /100 | #26 | Exceptional 77.9% |
| Immigrants | Micronesia | 100.0 /100 | #27 | Exceptional 77.8% |
| Belgians | 100.0 /100 | #28 | Exceptional 77.8% |
| Slovaks | 100.0 /100 | #29 | Exceptional 77.7% |
| Swiss | 100.0 /100 | #30 | Exceptional 77.7% |
| Poles | 100.0 /100 | #31 | Exceptional 77.6% |
| English | 100.0 /100 | #32 | Exceptional 77.6% |
| Immigrants | Ethiopia | 100.0 /100 | #33 | Exceptional 77.5% |
| German Russians | 100.0 /100 | #34 | Exceptional 77.5% |
| Immigrants | Eastern Africa | 100.0 /100 | #35 | Exceptional 77.5% |
Demographics Similar to Central Americans by In Labor Force | Age 20-24
In terms of in labor force | age 20-24, the demographic groups most similar to Central Americans are Syrian (75.0%, a difference of 0.010%), Immigrants from Mexico (75.0%, a difference of 0.010%), Immigrants from Croatia (75.1%, a difference of 0.020%), South African (75.0%, a difference of 0.020%), and Yakama (75.1%, a difference of 0.030%).
| Demographics | Rating | Rank | In Labor Force | Age 20-24 |
| Immigrants | Philippines | 55.8 /100 | #169 | Average 75.1% |
| Mexicans | 52.1 /100 | #170 | Average 75.1% |
| Cajuns | 51.1 /100 | #171 | Average 75.1% |
| Yakama | 50.8 /100 | #172 | Average 75.1% |
| Immigrants | Croatia | 50.2 /100 | #173 | Average 75.1% |
| South Africans | 50.0 /100 | #174 | Average 75.0% |
| Syrians | 49.5 /100 | #175 | Average 75.0% |
| Central Americans | 48.7 /100 | #176 | Average 75.0% |
| Immigrants | Mexico | 47.8 /100 | #177 | Average 75.0% |
| Immigrants | Central America | 45.0 /100 | #178 | Average 75.0% |
| Immigrants | Latvia | 44.1 /100 | #179 | Average 75.0% |
| Immigrants | Czechoslovakia | 44.0 /100 | #180 | Average 75.0% |
| Africans | 42.5 /100 | #181 | Average 75.0% |
| Immigrants | South Africa | 36.9 /100 | #182 | Fair 74.9% |
| Immigrants | Costa Rica | 36.7 /100 | #183 | Fair 74.9% |