Cuban vs Belgian In Labor Force | Age 20-24
COMPARE
Cuban
Belgian
In Labor Force | Age 20-24
In Labor Force | Age 20-24 Comparison
Cubans
Belgians
72.5%
IN LABOR FORCE | AGE 20-24
0.0/ 100
METRIC RATING
301st/ 347
METRIC RANK
77.8%
IN LABOR FORCE | AGE 20-24
100.0/ 100
METRIC RATING
28th/ 347
METRIC RANK
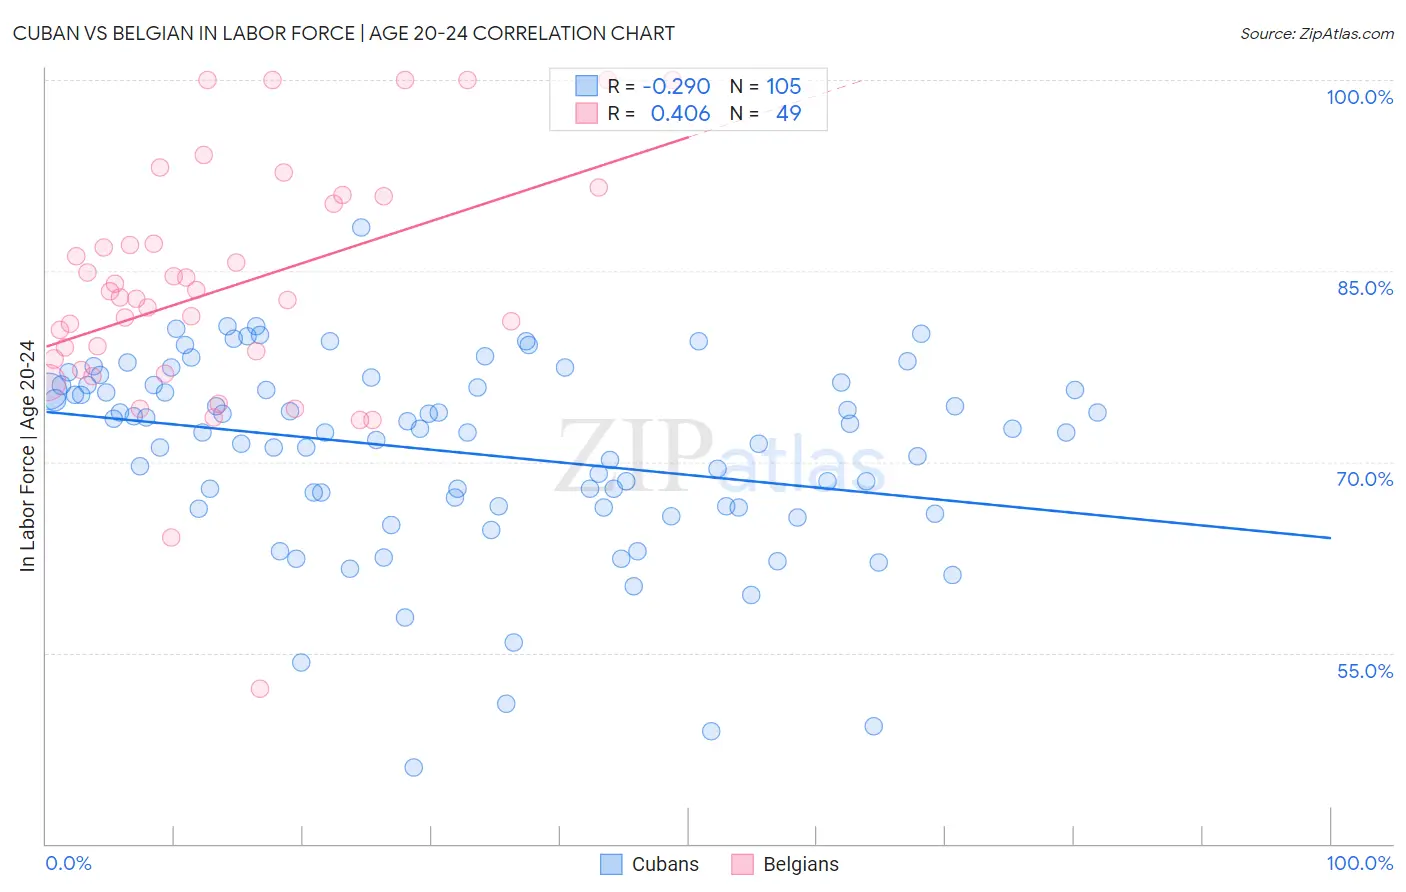
Cuban vs Belgian In Labor Force | Age 20-24 Correlation Chart
The statistical analysis conducted on geographies consisting of 449,113,848 people shows a weak negative correlation between the proportion of Cubans and labor force participation rate among population between the ages 20 and 24 in the United States with a correlation coefficient (R) of -0.290 and weighted average of 72.5%. Similarly, the statistical analysis conducted on geographies consisting of 355,814,007 people shows a moderate positive correlation between the proportion of Belgians and labor force participation rate among population between the ages 20 and 24 in the United States with a correlation coefficient (R) of 0.406 and weighted average of 77.8%, a difference of 7.3%.
In Labor Force | Age 20-24 Correlation Summary
| Measurement | Cuban | Belgian |
| Minimum | 46.0% | 52.2% |
| Maximum | 88.4% | 100.0% |
| Range | 42.4% | 47.8% |
| Mean | 70.8% | 83.6% |
| Median | 72.4% | 82.9% |
| Interquartile 25% (IQ1) | 66.4% | 77.6% |
| Interquartile 75% (IQ3) | 76.0% | 90.6% |
| Interquartile Range (IQR) | 9.6% | 13.0% |
| Standard Deviation (Sample) | 7.6% | 9.6% |
| Standard Deviation (Population) | 7.6% | 9.5% |
Similar Demographics by In Labor Force | Age 20-24
Demographics Similar to Cubans by In Labor Force | Age 20-24
In terms of in labor force | age 20-24, the demographic groups most similar to Cubans are Armenian (72.5%, a difference of 0.070%), Iranian (72.6%, a difference of 0.090%), Native/Alaskan (72.4%, a difference of 0.090%), Ecuadorian (72.4%, a difference of 0.10%), and Immigrants from West Indies (72.4%, a difference of 0.11%).
| Demographics | Rating | Rank | In Labor Force | Age 20-24 |
| Immigrants | Argentina | 0.0 /100 | #294 | Tragic 72.8% |
| Okinawans | 0.0 /100 | #295 | Tragic 72.7% |
| Jamaicans | 0.0 /100 | #296 | Tragic 72.7% |
| Central American Indians | 0.0 /100 | #297 | Tragic 72.7% |
| Israelis | 0.0 /100 | #298 | Tragic 72.6% |
| Iranians | 0.0 /100 | #299 | Tragic 72.6% |
| Armenians | 0.0 /100 | #300 | Tragic 72.5% |
| Cubans | 0.0 /100 | #301 | Tragic 72.5% |
| Natives/Alaskans | 0.0 /100 | #302 | Tragic 72.4% |
| Ecuadorians | 0.0 /100 | #303 | Tragic 72.4% |
| Immigrants | West Indies | 0.0 /100 | #304 | Tragic 72.4% |
| Immigrants | Singapore | 0.0 /100 | #305 | Tragic 72.4% |
| Immigrants | Jamaica | 0.0 /100 | #306 | Tragic 72.4% |
| Immigrants | Ecuador | 0.0 /100 | #307 | Tragic 72.3% |
| Soviet Union | 0.0 /100 | #308 | Tragic 72.3% |
Demographics Similar to Belgians by In Labor Force | Age 20-24
In terms of in labor force | age 20-24, the demographic groups most similar to Belgians are Immigrants from Micronesia (77.8%, a difference of 0.040%), Slovak (77.7%, a difference of 0.090%), Swiss (77.7%, a difference of 0.10%), Tongan (77.9%, a difference of 0.16%), and Tlingit-Haida (77.9%, a difference of 0.18%).
| Demographics | Rating | Rank | In Labor Force | Age 20-24 |
| Puget Sound Salish | 100.0 /100 | #21 | Exceptional 78.0% |
| Pennsylvania Germans | 100.0 /100 | #22 | Exceptional 78.0% |
| Yugoslavians | 100.0 /100 | #23 | Exceptional 78.0% |
| Liberians | 100.0 /100 | #24 | Exceptional 78.0% |
| Tlingit-Haida | 100.0 /100 | #25 | Exceptional 77.9% |
| Tongans | 100.0 /100 | #26 | Exceptional 77.9% |
| Immigrants | Micronesia | 100.0 /100 | #27 | Exceptional 77.8% |
| Belgians | 100.0 /100 | #28 | Exceptional 77.8% |
| Slovaks | 100.0 /100 | #29 | Exceptional 77.7% |
| Swiss | 100.0 /100 | #30 | Exceptional 77.7% |
| Poles | 100.0 /100 | #31 | Exceptional 77.6% |
| English | 100.0 /100 | #32 | Exceptional 77.6% |
| Immigrants | Ethiopia | 100.0 /100 | #33 | Exceptional 77.5% |
| German Russians | 100.0 /100 | #34 | Exceptional 77.5% |
| Immigrants | Eastern Africa | 100.0 /100 | #35 | Exceptional 77.5% |