Immigrants from Asia vs Belgian In Labor Force | Age 20-24
COMPARE
Immigrants from Asia
Belgian
In Labor Force | Age 20-24
In Labor Force | Age 20-24 Comparison
Immigrants from Asia
Belgians
73.6%
IN LABOR FORCE | AGE 20-24
0.5/ 100
METRIC RATING
263rd/ 347
METRIC RANK
77.8%
IN LABOR FORCE | AGE 20-24
100.0/ 100
METRIC RATING
28th/ 347
METRIC RANK
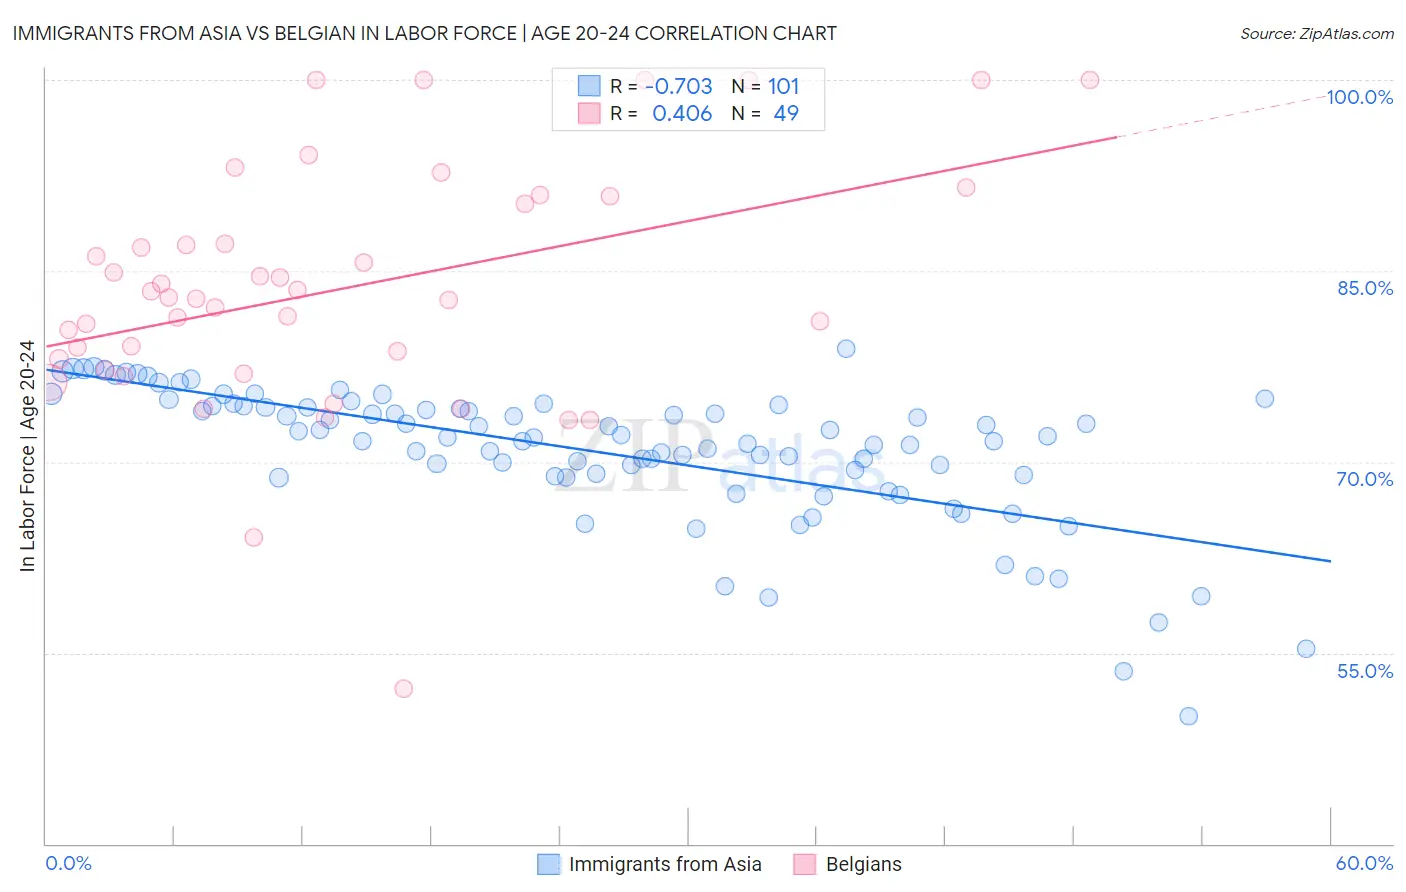
Immigrants from Asia vs Belgian In Labor Force | Age 20-24 Correlation Chart
The statistical analysis conducted on geographies consisting of 548,419,832 people shows a strong negative correlation between the proportion of Immigrants from Asia and labor force participation rate among population between the ages 20 and 24 in the United States with a correlation coefficient (R) of -0.703 and weighted average of 73.6%. Similarly, the statistical analysis conducted on geographies consisting of 355,814,007 people shows a moderate positive correlation between the proportion of Belgians and labor force participation rate among population between the ages 20 and 24 in the United States with a correlation coefficient (R) of 0.406 and weighted average of 77.8%, a difference of 5.7%.
In Labor Force | Age 20-24 Correlation Summary
| Measurement | Immigrants from Asia | Belgian |
| Minimum | 50.0% | 52.2% |
| Maximum | 78.9% | 100.0% |
| Range | 28.9% | 47.8% |
| Mean | 70.8% | 83.6% |
| Median | 72.0% | 82.9% |
| Interquartile 25% (IQ1) | 68.9% | 77.6% |
| Interquartile 75% (IQ3) | 74.4% | 90.6% |
| Interquartile Range (IQR) | 5.5% | 13.0% |
| Standard Deviation (Sample) | 5.5% | 9.6% |
| Standard Deviation (Population) | 5.5% | 9.5% |
Similar Demographics by In Labor Force | Age 20-24
Demographics Similar to Immigrants from Asia by In Labor Force | Age 20-24
In terms of in labor force | age 20-24, the demographic groups most similar to Immigrants from Asia are Immigrants from Haiti (73.6%, a difference of 0.010%), Burmese (73.6%, a difference of 0.020%), Haitian (73.6%, a difference of 0.030%), Immigrants from Western Asia (73.5%, a difference of 0.070%), and Asian (73.7%, a difference of 0.080%).
| Demographics | Rating | Rank | In Labor Force | Age 20-24 |
| Spanish American Indians | 0.8 /100 | #256 | Tragic 73.7% |
| Paraguayans | 0.8 /100 | #257 | Tragic 73.7% |
| Egyptians | 0.7 /100 | #258 | Tragic 73.7% |
| Dutch West Indians | 0.7 /100 | #259 | Tragic 73.7% |
| Immigrants | Turkey | 0.7 /100 | #260 | Tragic 73.7% |
| Houma | 0.6 /100 | #261 | Tragic 73.7% |
| Asians | 0.6 /100 | #262 | Tragic 73.7% |
| Immigrants | Asia | 0.5 /100 | #263 | Tragic 73.6% |
| Immigrants | Haiti | 0.5 /100 | #264 | Tragic 73.6% |
| Burmese | 0.5 /100 | #265 | Tragic 73.6% |
| Haitians | 0.5 /100 | #266 | Tragic 73.6% |
| Immigrants | Western Asia | 0.4 /100 | #267 | Tragic 73.5% |
| South Americans | 0.4 /100 | #268 | Tragic 73.5% |
| Colombians | 0.3 /100 | #269 | Tragic 73.5% |
| Immigrants | Russia | 0.3 /100 | #270 | Tragic 73.5% |
Demographics Similar to Belgians by In Labor Force | Age 20-24
In terms of in labor force | age 20-24, the demographic groups most similar to Belgians are Immigrants from Micronesia (77.8%, a difference of 0.040%), Slovak (77.7%, a difference of 0.090%), Swiss (77.7%, a difference of 0.10%), Tongan (77.9%, a difference of 0.16%), and Tlingit-Haida (77.9%, a difference of 0.18%).
| Demographics | Rating | Rank | In Labor Force | Age 20-24 |
| Puget Sound Salish | 100.0 /100 | #21 | Exceptional 78.0% |
| Pennsylvania Germans | 100.0 /100 | #22 | Exceptional 78.0% |
| Yugoslavians | 100.0 /100 | #23 | Exceptional 78.0% |
| Liberians | 100.0 /100 | #24 | Exceptional 78.0% |
| Tlingit-Haida | 100.0 /100 | #25 | Exceptional 77.9% |
| Tongans | 100.0 /100 | #26 | Exceptional 77.9% |
| Immigrants | Micronesia | 100.0 /100 | #27 | Exceptional 77.8% |
| Belgians | 100.0 /100 | #28 | Exceptional 77.8% |
| Slovaks | 100.0 /100 | #29 | Exceptional 77.7% |
| Swiss | 100.0 /100 | #30 | Exceptional 77.7% |
| Poles | 100.0 /100 | #31 | Exceptional 77.6% |
| English | 100.0 /100 | #32 | Exceptional 77.6% |
| Immigrants | Ethiopia | 100.0 /100 | #33 | Exceptional 77.5% |
| German Russians | 100.0 /100 | #34 | Exceptional 77.5% |
| Immigrants | Eastern Africa | 100.0 /100 | #35 | Exceptional 77.5% |