Cuban vs Belizean In Labor Force | Age 20-24
COMPARE
Cuban
Belizean
In Labor Force | Age 20-24
In Labor Force | Age 20-24 Comparison
Cubans
Belizeans
72.5%
IN LABOR FORCE | AGE 20-24
0.0/ 100
METRIC RATING
301st/ 347
METRIC RANK
73.4%
IN LABOR FORCE | AGE 20-24
0.3/ 100
METRIC RATING
272nd/ 347
METRIC RANK
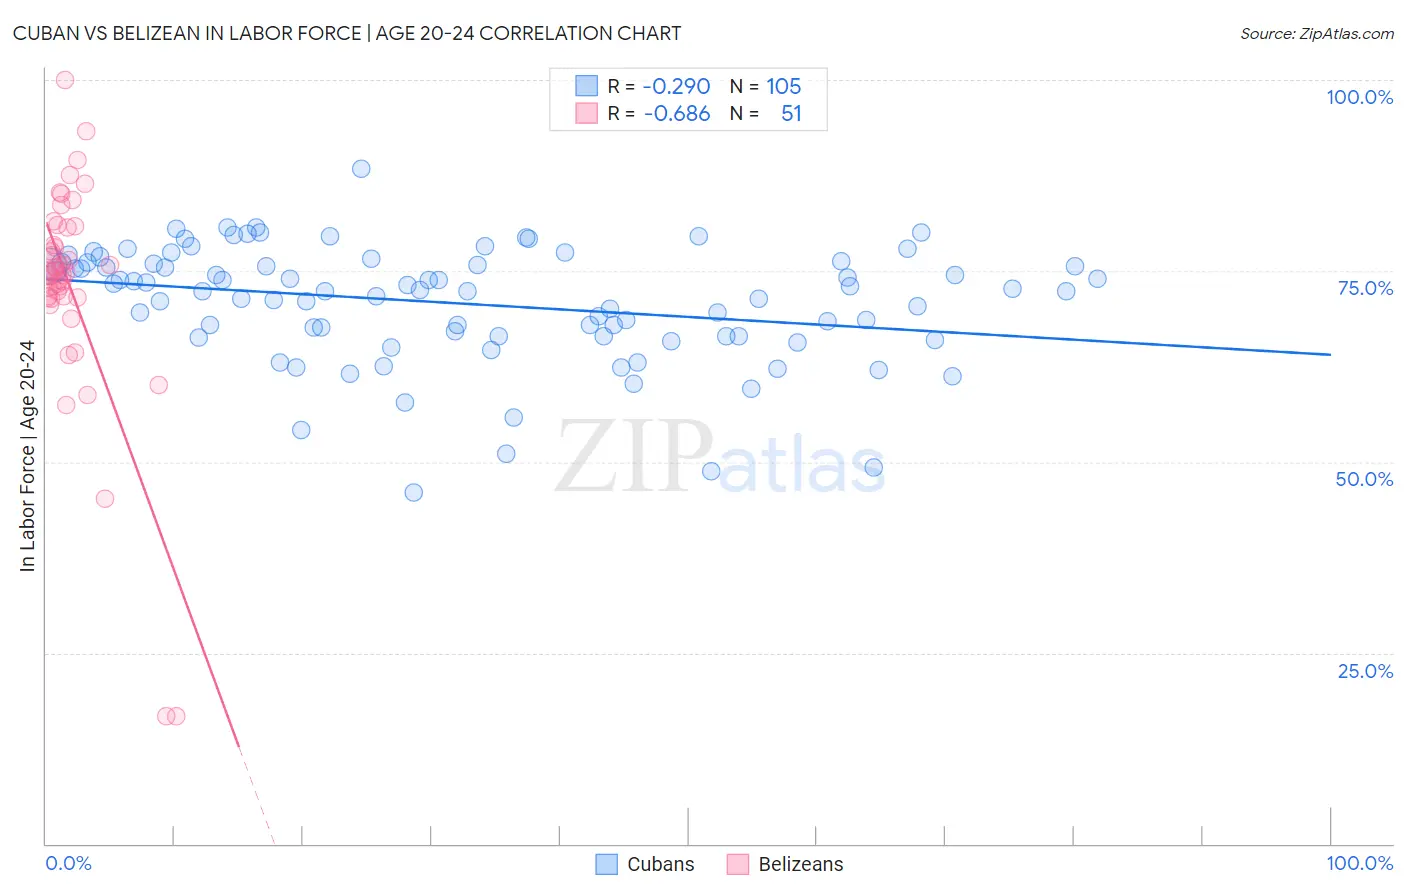
Cuban vs Belizean In Labor Force | Age 20-24 Correlation Chart
The statistical analysis conducted on geographies consisting of 449,113,848 people shows a weak negative correlation between the proportion of Cubans and labor force participation rate among population between the ages 20 and 24 in the United States with a correlation coefficient (R) of -0.290 and weighted average of 72.5%. Similarly, the statistical analysis conducted on geographies consisting of 144,207,582 people shows a significant negative correlation between the proportion of Belizeans and labor force participation rate among population between the ages 20 and 24 in the United States with a correlation coefficient (R) of -0.686 and weighted average of 73.4%, a difference of 1.3%.
In Labor Force | Age 20-24 Correlation Summary
| Measurement | Cuban | Belizean |
| Minimum | 46.0% | 16.7% |
| Maximum | 88.4% | 100.0% |
| Range | 42.4% | 83.3% |
| Mean | 70.8% | 73.0% |
| Median | 72.4% | 74.6% |
| Interquartile 25% (IQ1) | 66.4% | 71.5% |
| Interquartile 75% (IQ3) | 76.0% | 80.8% |
| Interquartile Range (IQR) | 9.6% | 9.3% |
| Standard Deviation (Sample) | 7.6% | 14.6% |
| Standard Deviation (Population) | 7.6% | 14.5% |
Similar Demographics by In Labor Force | Age 20-24
Demographics Similar to Cubans by In Labor Force | Age 20-24
In terms of in labor force | age 20-24, the demographic groups most similar to Cubans are Armenian (72.5%, a difference of 0.070%), Iranian (72.6%, a difference of 0.090%), Native/Alaskan (72.4%, a difference of 0.090%), Ecuadorian (72.4%, a difference of 0.10%), and Immigrants from West Indies (72.4%, a difference of 0.11%).
| Demographics | Rating | Rank | In Labor Force | Age 20-24 |
| Immigrants | Argentina | 0.0 /100 | #294 | Tragic 72.8% |
| Okinawans | 0.0 /100 | #295 | Tragic 72.7% |
| Jamaicans | 0.0 /100 | #296 | Tragic 72.7% |
| Central American Indians | 0.0 /100 | #297 | Tragic 72.7% |
| Israelis | 0.0 /100 | #298 | Tragic 72.6% |
| Iranians | 0.0 /100 | #299 | Tragic 72.6% |
| Armenians | 0.0 /100 | #300 | Tragic 72.5% |
| Cubans | 0.0 /100 | #301 | Tragic 72.5% |
| Natives/Alaskans | 0.0 /100 | #302 | Tragic 72.4% |
| Ecuadorians | 0.0 /100 | #303 | Tragic 72.4% |
| Immigrants | West Indies | 0.0 /100 | #304 | Tragic 72.4% |
| Immigrants | Singapore | 0.0 /100 | #305 | Tragic 72.4% |
| Immigrants | Jamaica | 0.0 /100 | #306 | Tragic 72.4% |
| Immigrants | Ecuador | 0.0 /100 | #307 | Tragic 72.3% |
| Soviet Union | 0.0 /100 | #308 | Tragic 72.3% |
Demographics Similar to Belizeans by In Labor Force | Age 20-24
In terms of in labor force | age 20-24, the demographic groups most similar to Belizeans are Immigrants from Indonesia (73.4%, a difference of 0.010%), Cheyenne (73.4%, a difference of 0.030%), Immigrants from Colombia (73.4%, a difference of 0.050%), Immigrants from Russia (73.5%, a difference of 0.060%), and Colombian (73.5%, a difference of 0.10%).
| Demographics | Rating | Rank | In Labor Force | Age 20-24 |
| Burmese | 0.5 /100 | #265 | Tragic 73.6% |
| Haitians | 0.5 /100 | #266 | Tragic 73.6% |
| Immigrants | Western Asia | 0.4 /100 | #267 | Tragic 73.5% |
| South Americans | 0.4 /100 | #268 | Tragic 73.5% |
| Colombians | 0.3 /100 | #269 | Tragic 73.5% |
| Immigrants | Russia | 0.3 /100 | #270 | Tragic 73.5% |
| Immigrants | Indonesia | 0.3 /100 | #271 | Tragic 73.4% |
| Belizeans | 0.3 /100 | #272 | Tragic 73.4% |
| Cheyenne | 0.2 /100 | #273 | Tragic 73.4% |
| Immigrants | Colombia | 0.2 /100 | #274 | Tragic 73.4% |
| Immigrants | South America | 0.2 /100 | #275 | Tragic 73.3% |
| Mongolians | 0.2 /100 | #276 | Tragic 73.3% |
| Immigrants | Malaysia | 0.2 /100 | #277 | Tragic 73.3% |
| Cypriots | 0.2 /100 | #278 | Tragic 73.3% |
| Venezuelans | 0.2 /100 | #279 | Tragic 73.3% |